
Third Down...One To Go: 2017 Q4 Looms For U.S. Equities
The following charts and graphs present a simplified birds-eye view of how the S&P 500 Index, and its volatility, performed in Q3 of 2017, as well as year-to-date.
But, first, a look at the Major Indices and 9 Major Sectors and how they have fared year-to-date and during Q3...
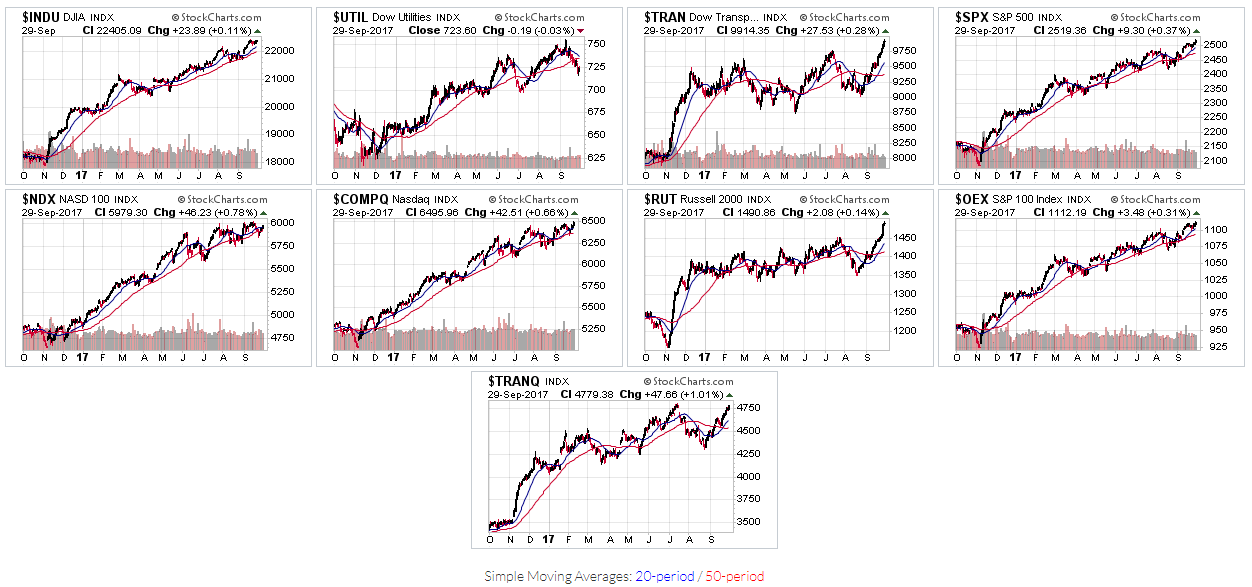
MAJOR INDICES
Eight of the nine Major Indices, namely, the Dow 30, Dow Transports, S&P 500, Nasdaq 100, Nasdaq Composite, Russell 2000, S&P 100, and Nasdaq Transportation Indices closed out Q3 at or near all-time highs, as shown on the following 1-Year Daily charts.
(Click on image to enlarge)
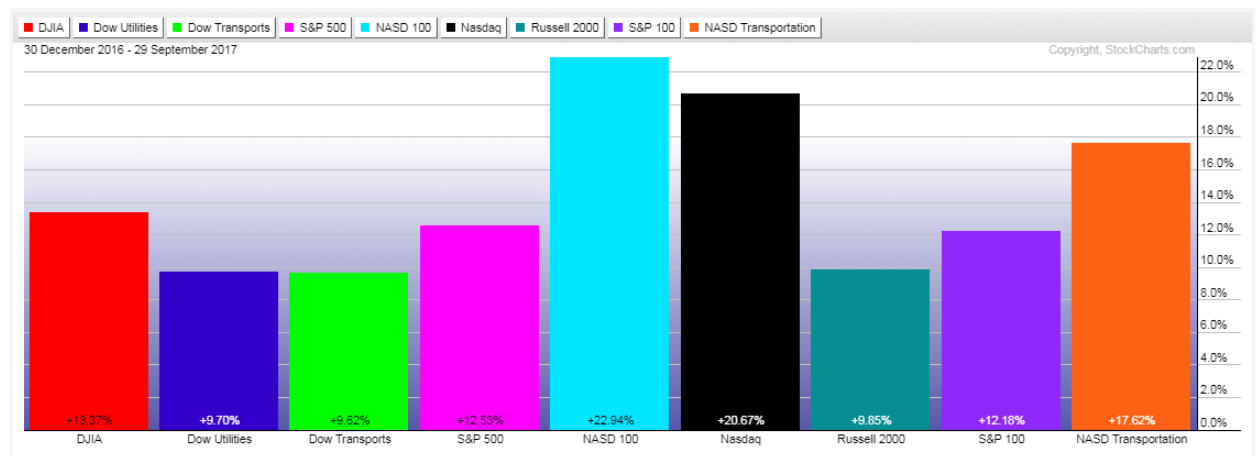
The following Year-to-date graph shows the percentages gained for the Major Indices.
The SPX has gained 12.53%, so far, this year. This exceeds my forecast of around an 11% gain for the entire year, as outlined in my post of December 1, 2016. The Dow 30 regained and held its footing above 22,000, and the SPX, OEX, and NDX reached their "Big Round Numbers" of 2500, 1100, and 6000, respectively, as I cited as a possibility on August 4.
(Click on image to enlarge)
The next graph shows the percentages gained during Q3 for these Major Indices.
Market players were willing to add more risk in the form of Small-cap stocks.
(Click on image to enlarge)

9 MAJOR SECTORS
Four of the nine Major Sectors closed out Q3 at or near their highs for the year, namely, Technology, Industrials, Materials, and Financials, as shown on the following 1-Year Daily charts.
(Click on image to enlarge)

Technology and Health Care have gained the most, so far, this year, followed by Industrials, Materials, Financials, Utilities, Cyclicals, and Consumer Staples, while Energy is -6.69%, as shown on the following Year-to-date graph.
(Click on image to enlarge)

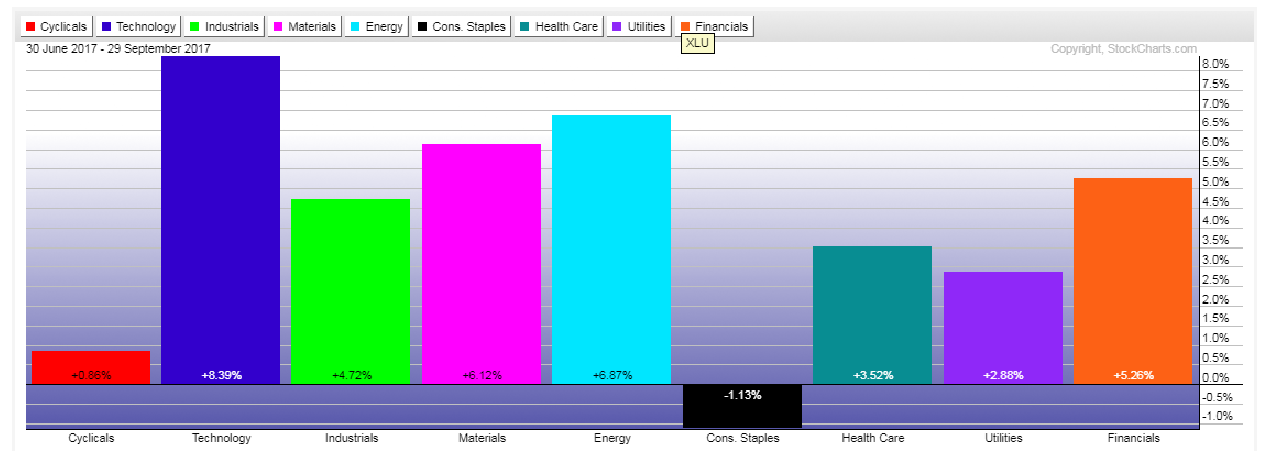
The leader for Q3 of 2017 is Technology, followed by Energy, Materials, Financials, Industrials, Health Care, Utilities, Cyclicals, while Consumer Staples is -1.13%.
(Click on image to enlarge)
S&P 500 INDEX
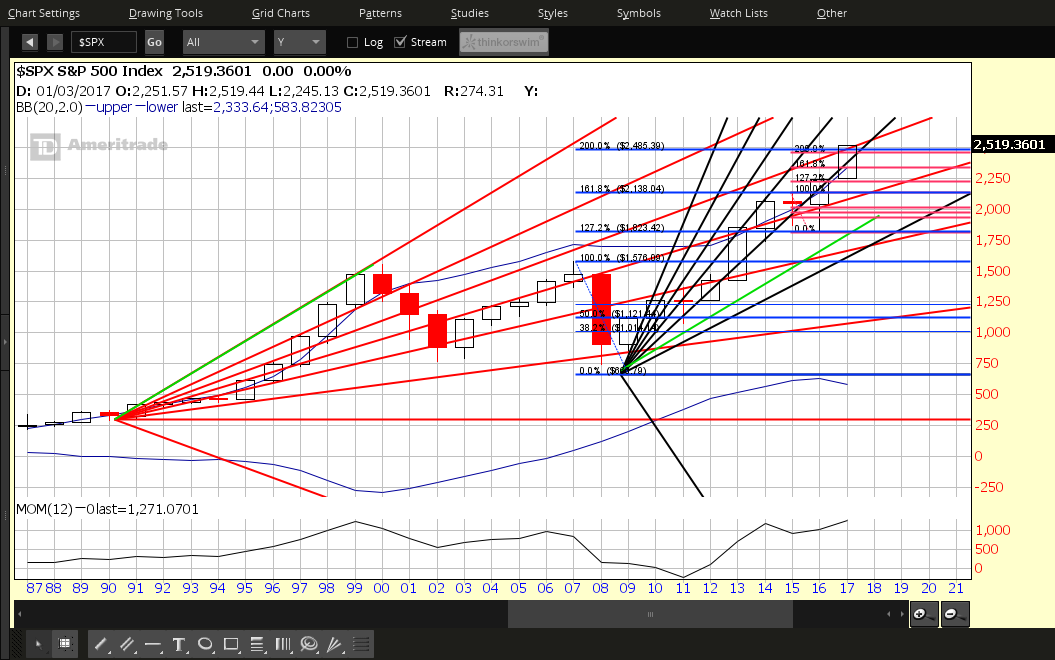
Each candle on the following four charts of the SPX represents a period of one year, one quarter, one month, and one week, respectively.
Its price, at 2500, is now entangled in a web of triple major resistance in the form of a 27-year Fibonacci fanline, an 8-year Fibonacci fanline and an 8-year external Fibonacci retracement level.
The momentum indicator is presenting somewhat mixed signals on these timeframes...with the weekly, monthly and quarterly hinting of a possible buying slowdown, stagnation, or reversal looming in Q4.
(Click on image to enlarge)


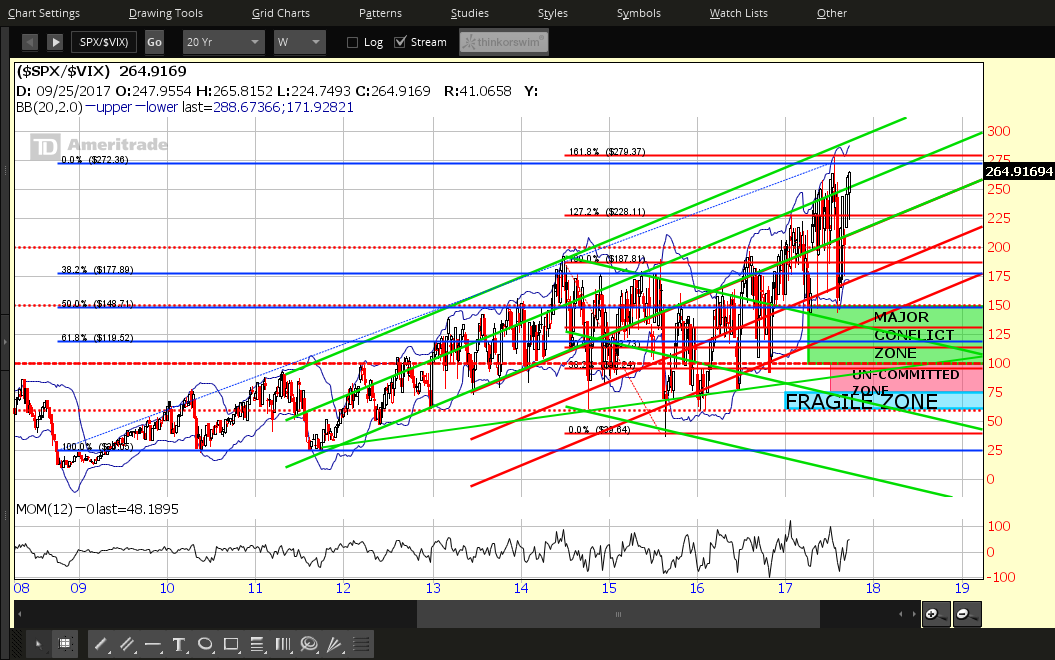
SPX:VIX RATIO
Each candle on the following four charts of the SPX:VIX ratio represents a period of one year, one quarter, one month, and one week, respectively. Price has closed near its all-time high and will be facing major channel and external Fib retracement resistance around the 280 level.
The momentum indicator is also presenting mixed signals on these timeframes...with the weekly and monthly hinting of possible higher volatility occuring in Q4. I recently wrote about higher volatility looming for Q4 here. Price will need to remain above 250 in the short term, and above the 200 New Bull Market level in the medium term, in order to confirm a sustainable upward bias for the SPX.
(Click on image to enlarge)


CONCLUSIONS
With both the SPX and SPX:VIX ratio at/near their all-time highs, and at or near long-term major resistance, technically, we could very well see some major profit-taking occur in equities, in general, in Q4, on increasing volatility, with a rotation into Commodities, the U.S. Dollar, Cyclicals, Consumer Staples, Utilities, and maybe Financials.
Watch for the SPX to either remain above 2500, or drop below...and for price on the SPX:VIX ratio to either remain above the 250 level, or drop below...to signal either continued low volatility, or an increase for Q4 of 2017.


