
The Myths Of Stocks For The Long Run – Part III
<< Read More: The Myths Of Stocks For The Long Run - Part I
<< Read More: The Myths Of Stocks For The Long Run – Part II
Written by Lance Roberts, Michael Lebowitz, CFA and John Coumarianos, M.S. of Real Investment Advice
Valuations & Forward Returns
“Part III” of this series will discuss the issue of valuations, the impact on forward returns as it relates to investment outcomes, and withdrawal rates in retirement.
As discussed previously:
“Investors do NOT have 90, 100, or more years to invest. Given that most investors do not start seriously saving for retirement until the age of 35, or older, they have 30-35 years to reach their goals. If that stretch of time happens to include a 12-15 year period in which returns are flat, as history tells us is probable, then the odds of achieving their goals are massively diminished.”
But what drives those12-15 year periods of flat to little return? Valuations.
In this article, we focus on the Shiller Cyclically Adjusted Price to Earnings Ratio or CAPE. This technique differs from most other price-to-earnings ratios as it takes a longer-term view by using ten-year average of earnings. The graph below shows how this compares over time.
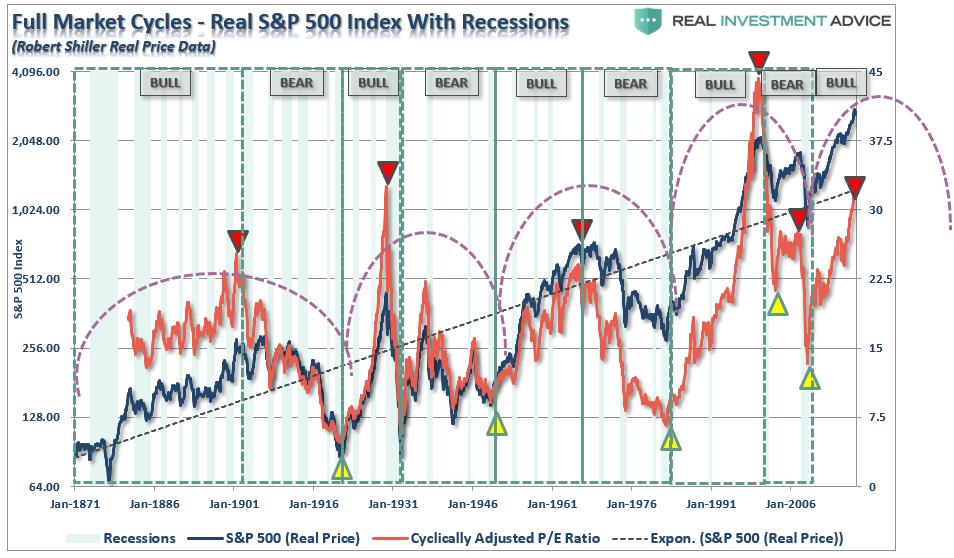
What is clear, and unarguable, is that when valuations are elevated, future returns on investments decline. There are two ways in which the ratio can revert back to levels where future returns on investments rise. 1) Prices can rapidly decline, or 2) Earnings can rise significantly while prices remain flat. Historically, and as shown above, option 2) has never been a previous outcome.
One great thing about valuations, such as CAPE, is that we can use them to help us form expectations around risk and return. The graph below shows the actual 30-year annualized returns that accompanied given levels of CAPE.
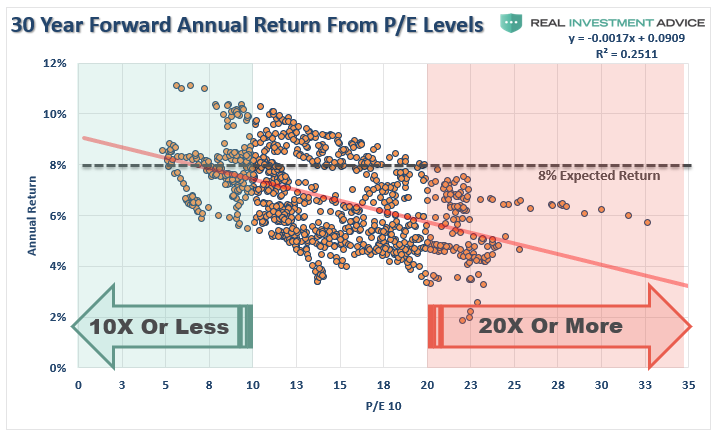
While it is crystal clear, as evidenced by the graph, as valuations rise future rates of annualized returns fall. This should not be a surprise as simple logic states that if you overpay today for an asset, future returns must, and will, be lower.
Math also proves the same. Capital gains from markets are primarily a function of market capitalization, nominal economic growth plus the dividend yield. Using the Dr. John Hussman’s formula we can mathematically calculate returns over the next 10-year period as follows:
(1+nominal GDP growth)*(normal market cap to GDP ratio / actual market cap to GDP ratio)^(1/10)-1
Therefore, IF we assume that
- GDP attains, and maintains, 4% annualized growth starting immediately, AND
- There are NO recessions, AND
- Current market cap/GDP stays flat at 1.25, AND
- The current dividend yield of roughly 2% remains,
We would get forward returns of:
(1.04)*(.8/1.25)^(1/30)-1+.02 = 4.5%
But there’s a “whole lotta ifs” in that assumption.
More importantly, if we assume that inflation remains stagnant at 2%, as the Fed hopes, this would mean a real rate of return of just 2.5%.
This is far less than the 8-10% rates of return currently promised by the Wall Street community. It is also why starting valuations are critical for individuals to understand when planning for the accumulation phase of the investment life-cycle.
Let’s take this a step further. For the purpose of this article, we went back through history and pulled the 4-periods where valuations were either above 20x earnings or below 10x earnings. We then ran a $1000 investment going forward for 30-years on a total-return, inflation-adjusted, basis.
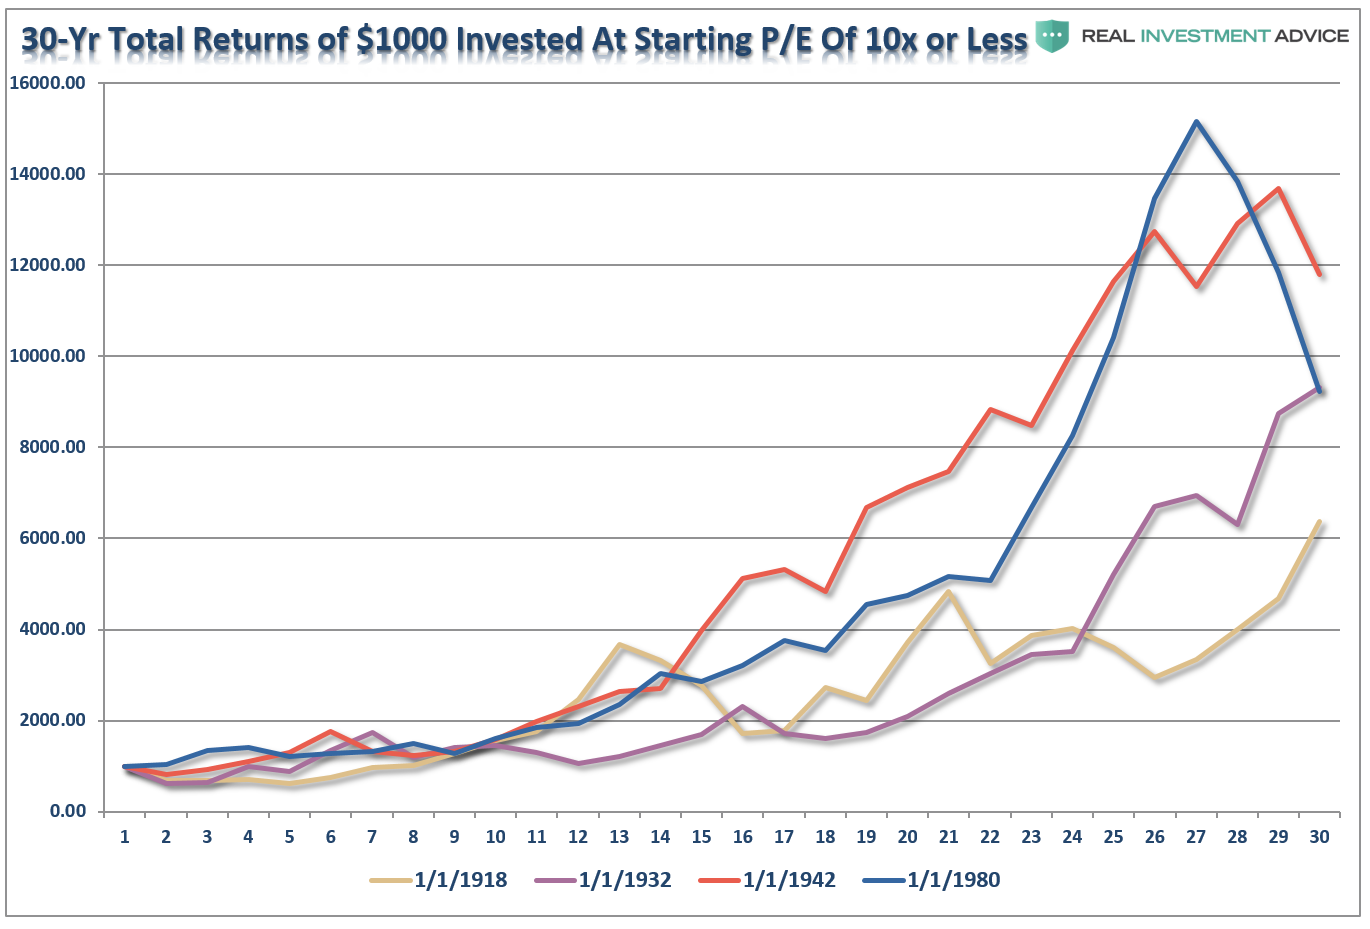
At 10x earnings, the worst performing period started in 1918 and only saw $1000 grow to a bit more than $6000. The best performing period was actually not the screaming bull market that started in 1980 because the last 10-years of that particular cycle caught the “dot.com” crash. It was the post-WWII bull market that ran from 1942 through 1972 that was the winner. Of course, the crash of 1974, just two years later, extracted a good bit of those returns.
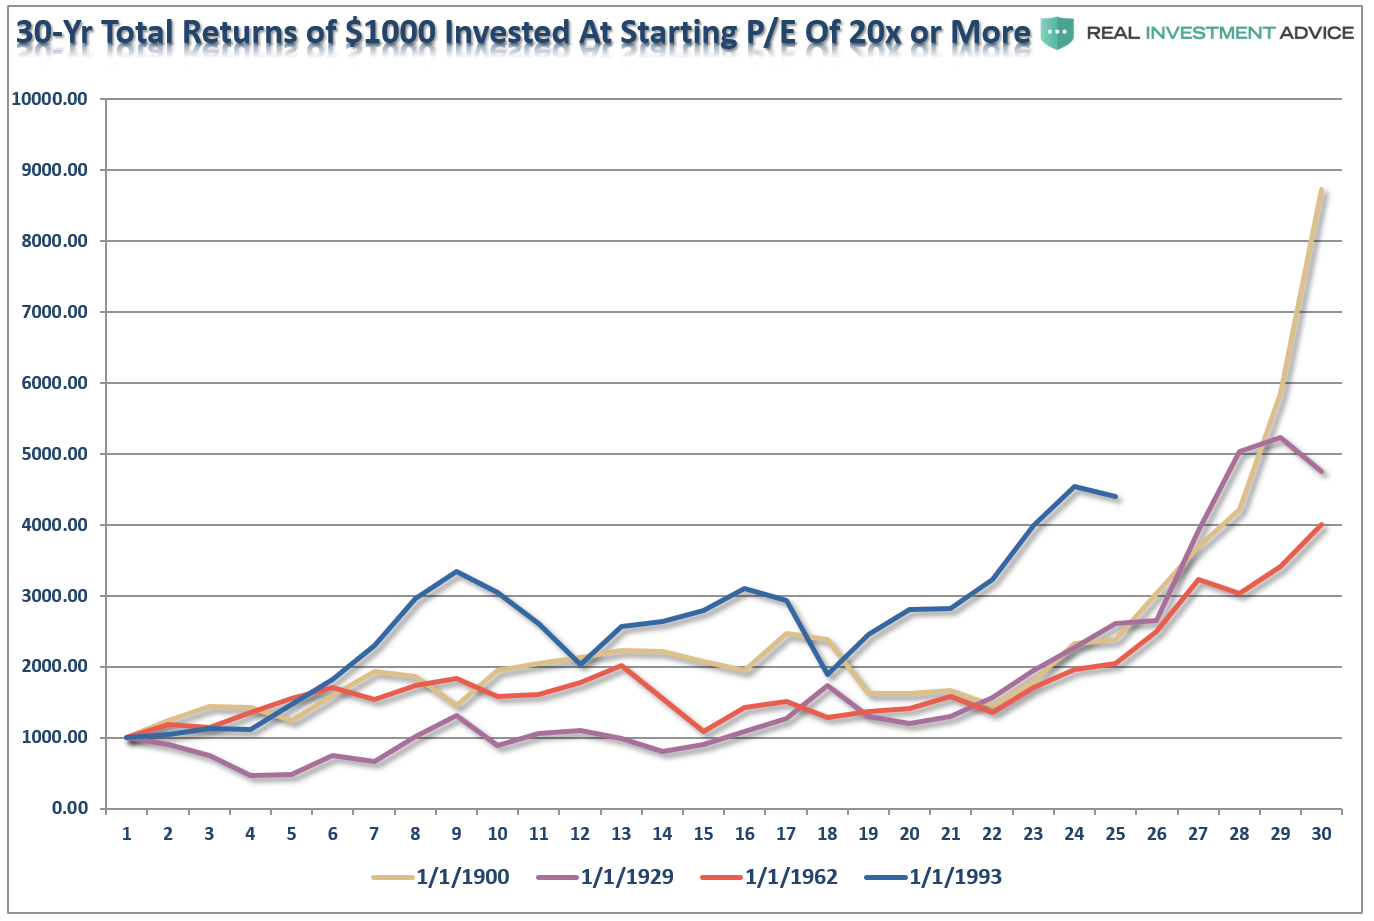
Conversely, at 20x earnings, the best performing period started in 1900 which caught the rise of the market to its peak in 1929. Unfortunately, the next 4-years wiped out roughly 85% of those gains. However, outside of that one period, all of the other periods fared worse than investing at lower valuations. (Note: 1993 is still currently running as its 30-year period will end in 2023.)
The point to be made here is simple and was precisely summed up by Warren Buffett:
“Price is what you pay. Value is what you get.”
This idea becomes much clearer by showing the value of $1000 invested in the markets at both valuations BELOW 10x trailing earnings and ABOVE 20x. I have averaged each of the 4-periods above into a single total return, inflation-adjusted, index, Clearly, investing at 10x earnings yields substantially better results.
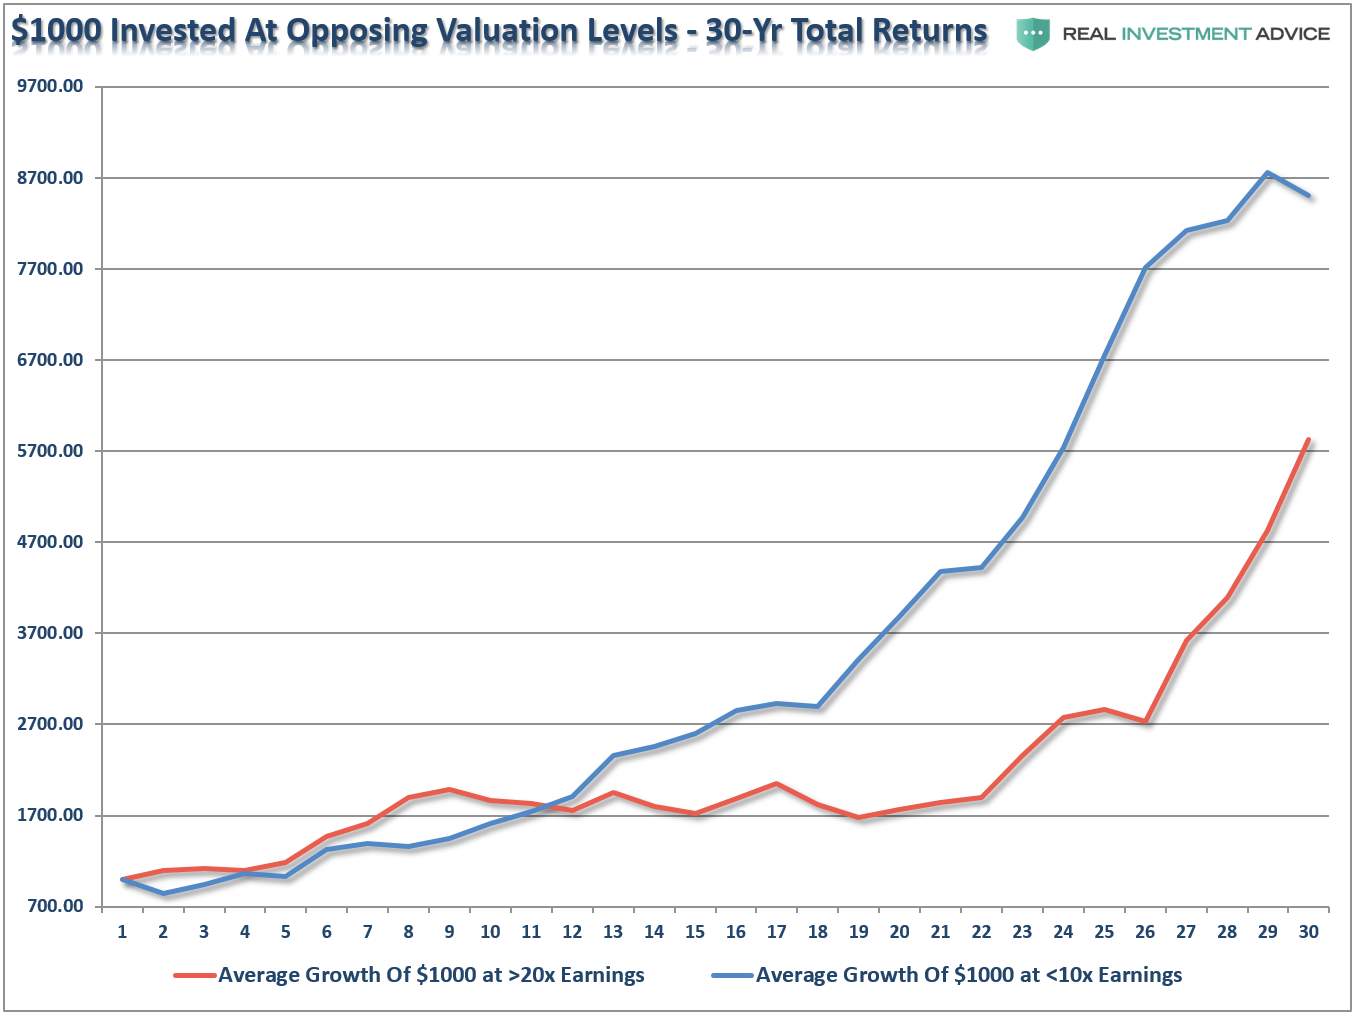
Not surprisingly, the starting level of valuations has the greatest impact on your future results.
But, in investing, getting to your destination is only half of the journey.
Starting Valuations Are Critical To Withdrawal Rates
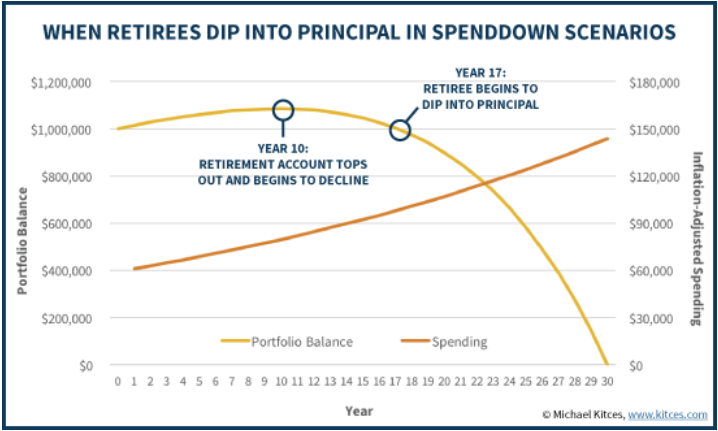
Valuations have even a bigger, and vastly more critical, impact on the outcomes of withdrawal rates during retirement. Michael Kitces wrote an article discussing the withdrawal rate in retirement (Why Most Retirees Will Never Draw Down Their Retirement Portfolio) where he laid out a typical example of a retirement portfolio during the distribution phase of retirement.
“Given the impact of inflation, it’s problematic to start digging into retirement principal immediately at the start of retirement, given that inflation-adjusted spending needs could quadruple by the end of retirement (at a 5% inflation rate). Accordingly, the reality is that to sustain a multi-decade retirement with rising spending needs due to inflation, it’s necessary to spend less than the growth/income in the early years, just to build enough of a cushion to handle the necessary higher withdrawals later!
For instance, imagine a retiree who has a $1,000,000 balanced portfolio, and wants to plan for a 30-year retirement, where inflation averages 3% and the balanced portfolio averages 8% in the long run. To make the money last for the entire time horizon, the retiree would start out by spending $61,000 initially, and then adjust each subsequent year for inflation, spending down the retirement account balance by the end of the 30th year.”
Before we get into the variability of returns and starting market valuations, I want to dig deeper into Kitces’ premise above by looking at the impact of inflation-adjusted returns and taxation.
The first chart below expands on Kitces’ chart above by adjusted the 8% return structure for inflation at 3% and also adjusting the withdrawal rate up for taxation at 25%.
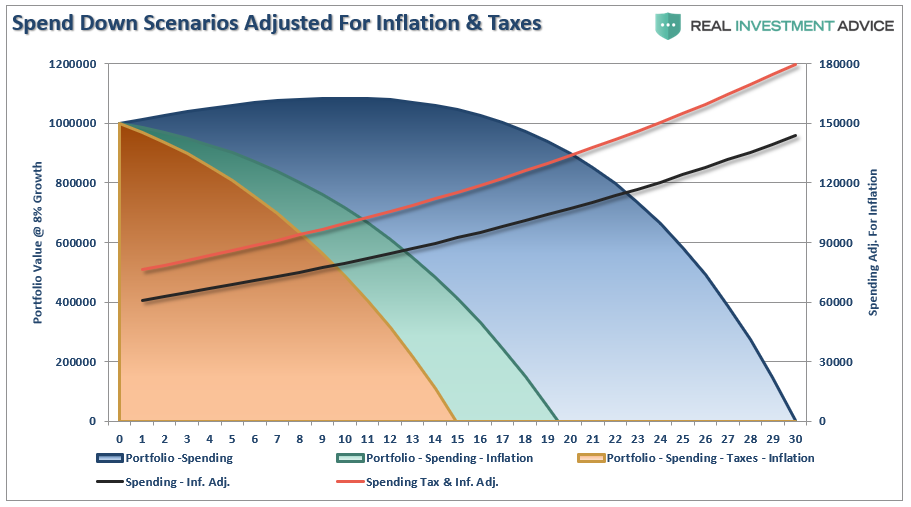
By adjusting the annualized rate of return for the impact of inflation and taxes the life expectancy of a portfolio grows considerably shorter. However, the other problem, as first stated above, is there is a significant difference between 8% annualized rates of return and 8% real rates of return.
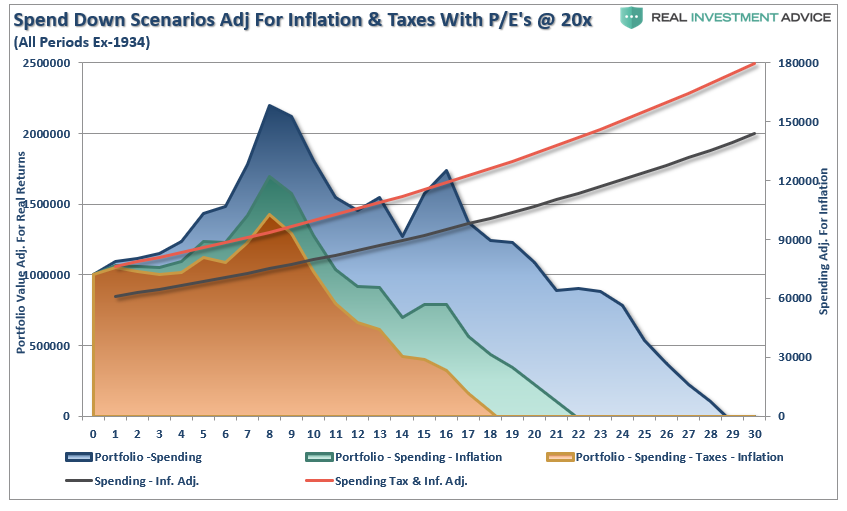
When we adjust the spend down structure for elevated starting valuation levels and include inflation and taxation, a much different, and far less favorable, financial outcome emerges – the retiree is out of money not in year 30, but in year 18.
So, with this understanding let me return once again to those that continue to insist the “buy and hold” is the only way to invest. The chart below shows $3000 invested annually into the S&P 500 inflation-adjusted, total return index at 10% compounded annually and both 10x and 20x valuation starting levels. I have also shown $3000 saved annually in a mattress.

The red line is 10% compounded annually. While you don’t get compounded returns, it is there for comparative purposes to the real returns received over the 30-year investment horizon starting at 10x and 20x valuation levels. The shortfall between the promised 10% annual rates of return and actual returns are shown in the two shaded areas. In other words, if you are banking on some advisor’s promise of 10% annual returns for retirement, you aren’t going to make it.
I want you to take note of the following.
When investing your money at valuations above 20x earnings, it takes 22-years before it has grown more than money stuffed in a mattress.
Why 22 years?
Take a look at the chart below.
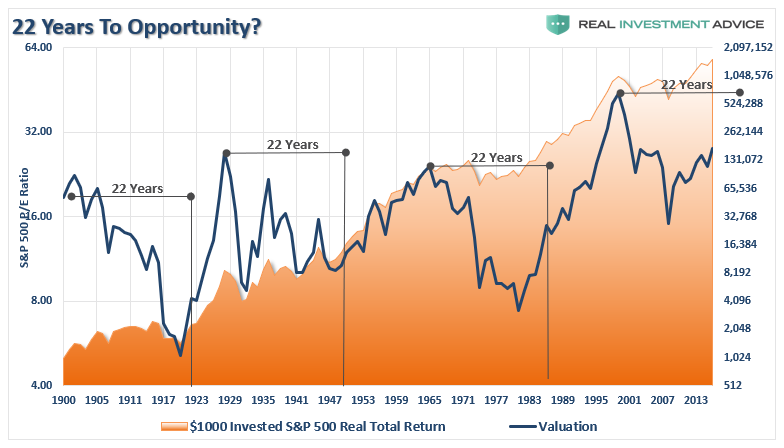
Historically, it has taken roughly 22-years to resolve a period of over-valuation. Given the last major over-valuation period started in 1999, history suggests another major market downturn will “mean revert” valuations by 2021.
The point here is obvious. Valuations are the ultimate arbiter of future returns. Whether you are in the first half of the investment cycle or the last, the single most important factor to your long-term success is at “what valuation level”did you start your journey?
Disclosure: The information contained in this article should not be construed as financial or investment advice on any subject matter. Real Investment Advice is expressly disclaims all liability in ...
more

