
T2108 Update – A Break In The Fever Of A Sick Stock Market
T2108 Status: 14.1% (jumped from 8.3%)
T2107 Status: 15.3% (jumped from 11.5%)
VIX Status: 22.3 (confirmed failure at resistance)
General (Short-term) Trading Call: bullish
Active T2108 periods: Day #11 under 20%, Day #14 under 30%, Day #30 under 40%, Day #34 below 50%, Day #49 under 60%, Day #390 under 70%
Commentary
The fever inflicting the market is finally breaking. A full recovery will likely remain elusive for quite some time.
On January 22, 2015, the S&P 500 (SPY) jumped 1.4%, a small gain with a lot of meaning.
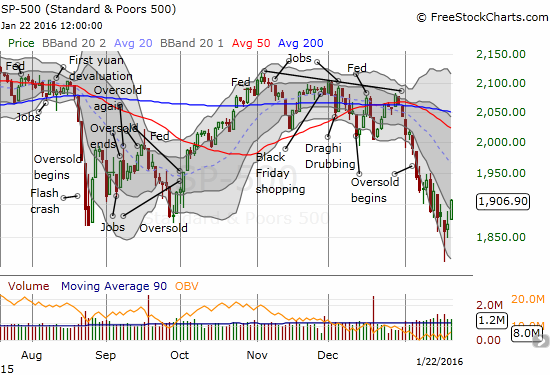
The S&P 500 (SPY) finally leaps out of its primary downtrend channel.
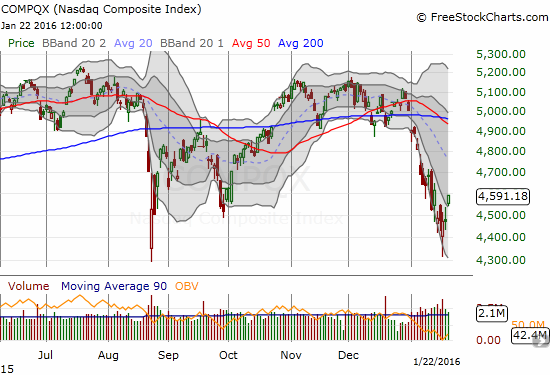
The NASDAQ has also managed to break its fever with a very clean breakout above the primary downtrend channel.
The charts above show an indices FINALLY breaking through a vicious downtrend channel defined by the two lower Bollinger Bands (BBs). For the entire month of January to-date the S&P 500 feverishly descended this channel. The sickness remains evident from the ferocity of the breakdown from the 50 and 200DMAs. Moreover, all three major moving averages are now in full downtrends – the 20, 50, and 200DMAs.
The immediate fever first subsided as sellers exhausted themselves taking the index far below its lower-BB. As buyers took the index back to a near full recovery on the day, the volatility index (the VIX) also topped out. At that time, I concluded the following:
“I REALLY want to believe that the VIX’s on-going failure to sustain itself above the intraday high from 2012 is sign that firm resistance is building at that level. Such resistance would add more credence to the formation of a bottom…
In the last T2108 Update, I noted that I was content to wait for the VIX to surge well above its upper-BB before making any further trades. I decided today’s move qualified.”
The VIX is now in rapid descent.
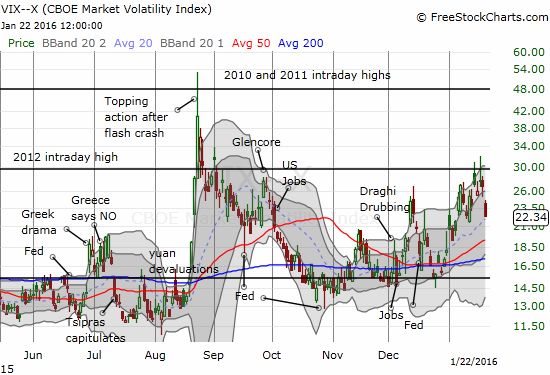
The volatility index, the VIX, has erased at least half of its recent breakout.
The sickness remains as long as the VIX is trending upward. All major trendlines are pointing upward – the 20, 50, and 200DMAs. Let’s see whether the Federal Reserve can this week work its typical magic and apply its special pressure on those uptrends.
T2108 added its vote of confidence by soaring from 8.3% to 14.1%. At the current pace, this oversold period will easily end this week. However, as I have noted in earlier posts, T2108 tends to add 4 days of oversold duration for every day it spends in single digits. T2108 spent 5 gut-wrenching days in single digits, so my forecast is for an amazingly long 25-day oversold period. T2108 has already spent 11 days in purgatory. Fourteen more trading days would take this market into the second week of February. Since such an extended duration would make this oversold period the third longest in my recorded history (going back to 1986), I am thinking a more likely scenario is something like last year’s August Angst where T2108 had trouble staying out of oversold conditions before a sustained bottom finally appeared at the beginning of October. The Fed meeting this week could catalyze the first relief point. I will make a fresh assessment when I see the market’s behavior on its first day out of oversold conditions.
Oil even added a vote of confidence. While I have demonstrated oil is very poorly correlated to the S&P 500, the market’s near obsession with all the negative impacts of oil’s collapse has meant that the majority of days (in 2015), oil and the S&P 500 DO move in the same direction. Oil surged the final two days of the week. I use the United States Oil ETF (USO) to show the sharpness of the move higher. If the fundamentals were not so bad for oil, I would confidently declare THE bottom for USO here. Instead, I will just say that this looks like a bottom with more staying power than the bottoms seen early in 2015.

United States Oil (USO) makes another bid for a bottom with a 13% 2-day surge from all-time lows.
For more clues on USO, I am now watching the CBOE Crude Oil Volatility Index (OVX) more closely. OVX remains VERY elevated, and the fever has not quite broken yet. Note that the blow-off top in early September ushered in two months of stability for USO.
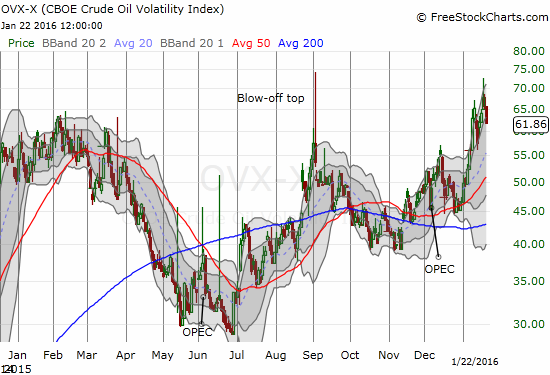
The surge in OVX, the volatility measure for USO, is not yet broken.
Even the currency markets confirmed the bullish push to end the week. The Australian dollar (FXA) versus the Japanese yen (FXY) jumped off its 3-year lows. The feverish downtrend in place the first two weeks of the year is broken. The current jump even leaves behind a bit of a base that should withstand a retest or two. Per my trading strategy, I have already started rebuilding a short AUD/JPY position as a hedge and my on-going bearishness on the Australian dollar.
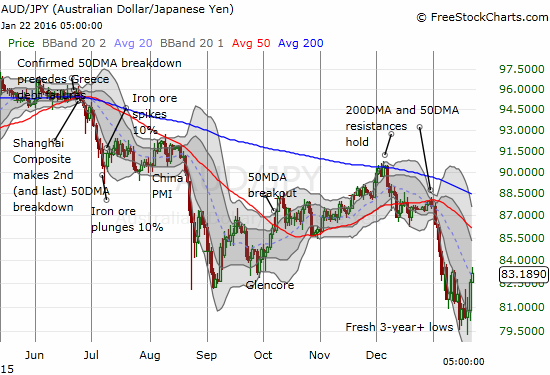
AUD/JPY is making a bottoming move. In so doing, it is confirming a likely bottom for the S&P 500.
The U.S. dollar index (DXY0) was helped upward by a fresh weakening in the euro (FXE). The recent strength of the euro has confirmed bearish sentiment translating into a “risk-off” positioning in the markets. So while strength in the dollar has typically been viewed as a negative, short-run strength from a weak euro could actually be very positive for market sentiment. Of course, the rhetoric from the Federal Reserve this week is very likely to undermine dollar strength in the short-term. The aftermath should feature a very interesting (and important) tension.
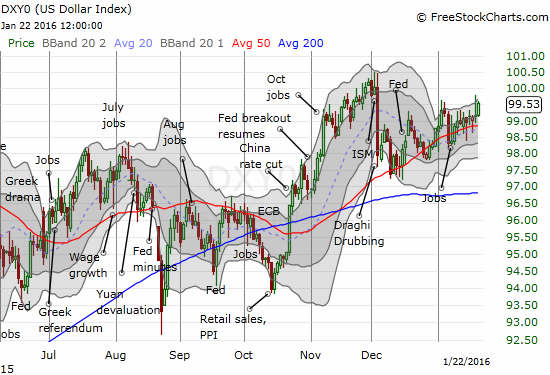
The U.S. dollar index has slowly trended upward ever since Mario Draghi of the ECB whacked it last month.
As usual, there are a LOT of interesting charts out there as a result of this breaking fever. I am showing a select few that either update trades or provide some nuanced windows into market sentiment.

Thanks to Piper Jaffray, Apple (AAPL) surged 5.3% and delivered a nice gain on my call options that I accumulated over the past two weeks. Prior to Friday, I had practically given up on the position ($99 strike).
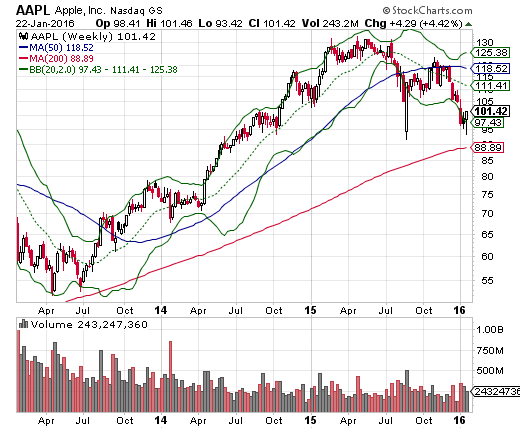
The weekly chart for AAPL is a stark reminder that AAPL remains a very sick stock. The lows from the flash crash held, but the stock looks like it is in its second phase of major topping action.
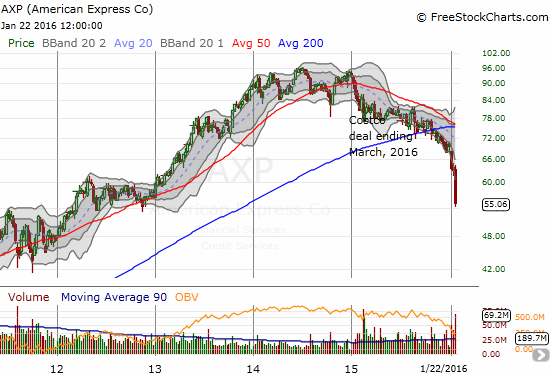
American Express (AXP) is still suffering a major fever. The latest earnings news added an exclamation mark to an on-going downtrend.
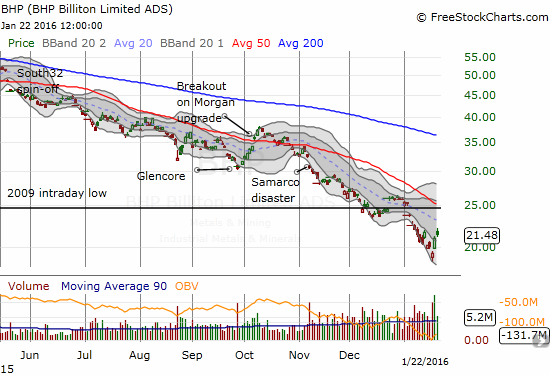
Buyers showed up in force for BHP Billiton Limited (BHP) . However, fundamentals look SO bad for BHP and its ilk, I broke my T2108 trading rules to load up on put options to fade Friday’s high. A rush of put buyers seemed to agree with me.
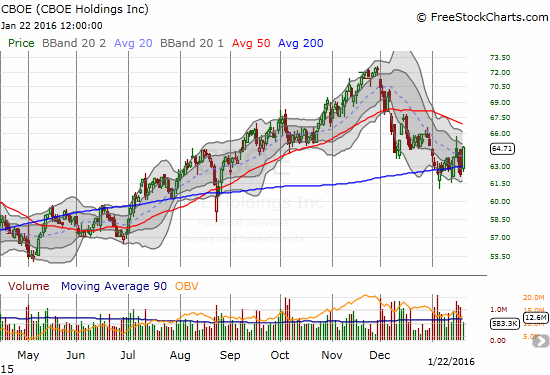
I am including CBOE Holdings, Inc. (CBOE) only because so few stocks have managed to hold 200DMA support through this oversold period. A buy on a 50DMA breakout makes a lot of sense here.
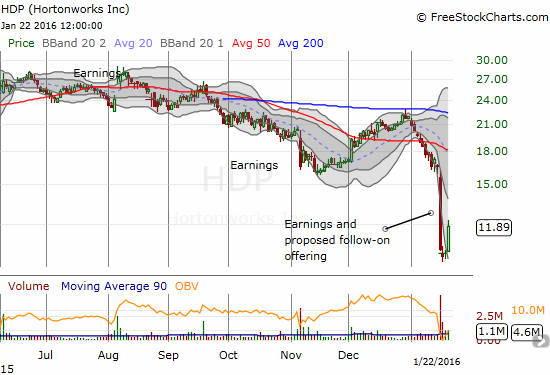
Hortonworks, Inc. (HDP) surges 16% off a classic bottoming pattern (two dojis representing an abrupt end to the preceding panic). So far, it seems I was correct in guessing that the previous selling was overdone.
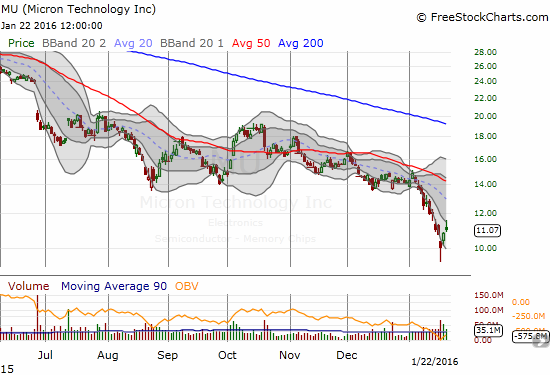
Micron Technology, Inc. (MU) printed one of the cleanest bottoming hammers I saw last week. When I saw traders loading up on MU call options on Friday, I quickly followed the crowd.
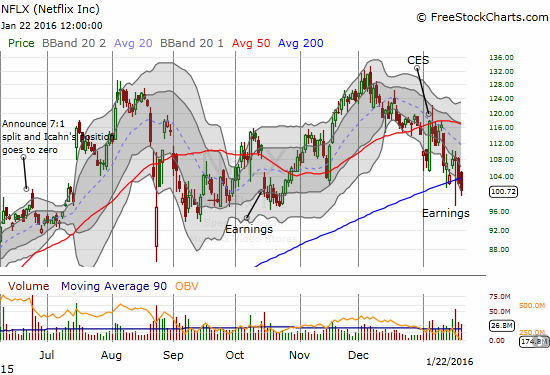
Netflix (NFLX) apparently did not get the memo about the imminent end of the oversold period. I am VERY surprised to see the relative weakness two days straight that has taken the stock to closes BELOW 200DMA support. Suddenly, an extended downtrend from the recent high has received confirmation.
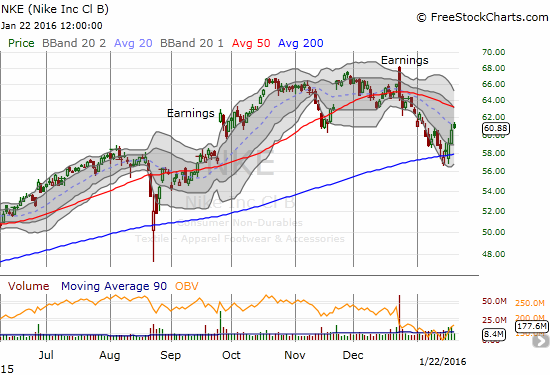
Nike (NKE) is keeping up the expected behavior of a leader. It held 200DMA support in the oversold period AND is pulling off a relatively clean bounce from support.
— – —
For readers interested in reviewing my trading rules for T2108, please see my post in the wake of the August Angst, “How To Profit From An EPIC Oversold Period“, and/or review my T2108 Resource Page.
Reference Charts (click for view of last 6 months from Stockcharts.com):
S&P 500 or SPY
U.S. Dollar Index (U.S. dollar)
EEM (iShares MSCI Emerging Markets)
VIX (volatility index)
VXX (iPath S&P 500 VIX Short-Term Futures ETN)
EWG (iShares MSCI Germany Index Fund)
CAT (Caterpillar).
IBB (iShares Nasdaq Biotechnology).
Daily T2108 vs the S&P 500

Black line: T2108 (measured on the right); Green line: S&P 500 (for comparative purposes)
Red line: T2108 Overbought (70%); Blue line: T2108 Oversold (20%)
Weekly T2108

*All charts created using freestockcharts.com unless otherwise stated
The charts above are the my LATEST updates independent of the date of this given T2108 post.
Be careful out there!
Disclosure: long SVXY shares, long and ...
more

