
Above The 40 – The S&P 500 Trips Over The Volatility Speedbump
AT40 = 55.9% of stocks are trading above their respective 40-day moving averages (DMAs)
AT200 = 60.6% of stocks are trading above their respective 200DMAs
VIX = 14.8
Short-term Trading Call: bullish
Commentary
Last Friday, the S&P 500 (SPY) rolled over a volatile dollar on its way to another all-time high. The volatility index, the VIX, rose up as the next speedbump, and the S&P 500 stumbled this time. The index fell 1.1% for its biggest 1-day loss in over 5 months. The two-day loss of 1.8% is the S&P 500’s largest since it lost 2.5% over two days on September 9, 2016! So while this decline is but a pinprick compared to the stock market’s relentless gains, I am guessing it feels awful to a lot of investors.
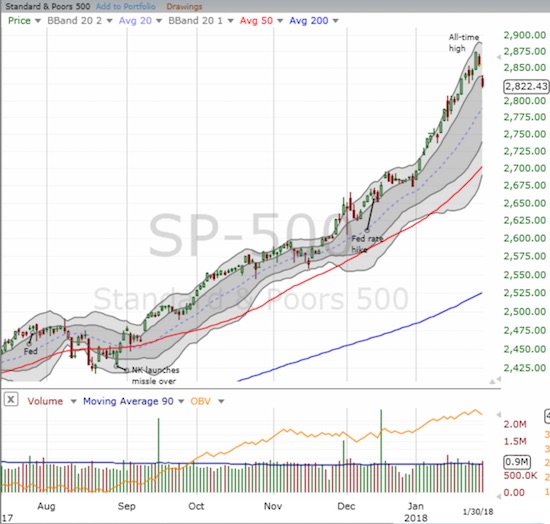
The S&P 500 (SPY) broke its primary uptrend defined by its upper-Bollinger Band (BB) channel
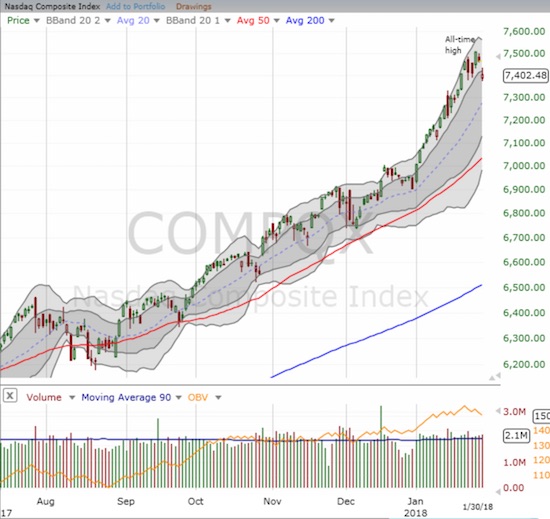
The NASDAQ marginally broke down below its primary uptrend support.
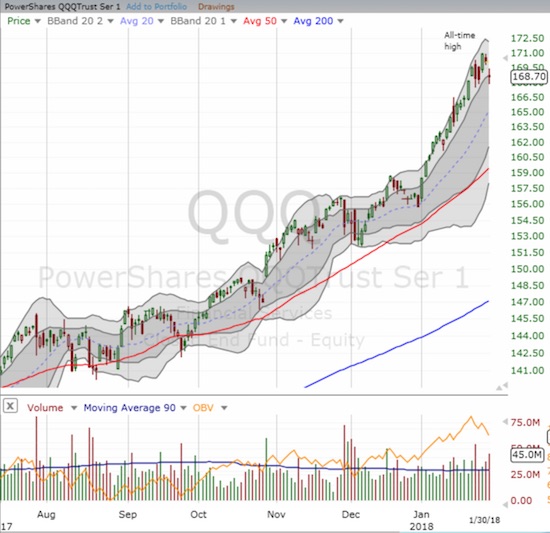
The PowerShares QQQ ETF (QQQ) declined 0.8% and just barely held onto its primary uptrend support.
The short-term trading call stays on bullish as I remain focused on buying the dip. The line in the sand between bullishness and bearishness is still around 2735. If the S&P 500 challenges that line, it may occur just above the uptrending 50-day moving average (DMA). If so, I may need to tweak the line below the 50DMA.
In recent posts, I pointed out the resiliency of the VIX since its last low on January 3, 2018. In my last Above the 40 post, I lamented that I may have lost discipline and moved too eagerly to bet on a further rise in volatility. Yet, I noted that the current week was full of events that could roil volatility. The market delivered in a big way. On Monday, the VIX surged 24.9%, and it followed up that performance with a 6.9% gain on Tuesday. With the VIX racing higher, I figured the volatility faders would show up in force at some point: a 25% spike usually marks a last gasp for angst. I tried to lock in my profits on my call options on ProShares Ultra VIX Short-Term Futures (UVXY). Fortunately, the market only filled half my order near the close of trading. I set a higher limit and got a fill right after the market opened on Tuesday.
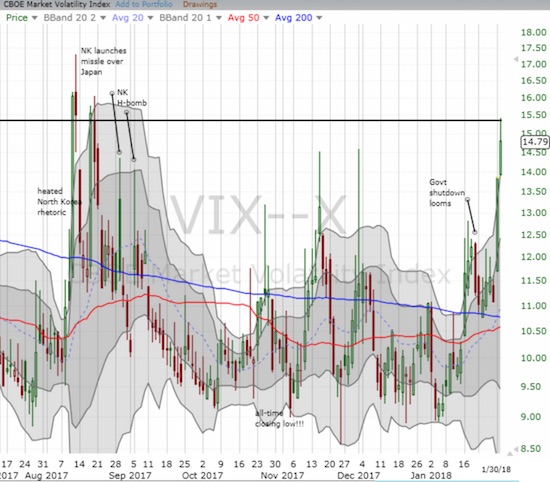
The volatility index, VIX, finally released its pent-up energy and tagged the 15.35 pivot. It closed at a 5-month high.
The VIX neatly pulled back from the 15.35 pivot. At that point, I decided it was time to join the volatility faders. With the concentrated news cycle in the rearview mirror, I am targeting the end of week for the market to start calming down. I bought a few put options on UVXY, and I plan to accumulate through the end of the week if they get cheaper. I may add to the mix a call option on ProShares Short VIX Short-Term Futures (SVXY).
#VIX is at 5+ month high and tagged the 15.35 pivot. Time to switch back to fading volatility. Target end of week for more calm. $VXX $UVXY pic.twitter.com/Pk9jaEBLvI
— Dr. Duru (@DrDuru) January 30, 2018
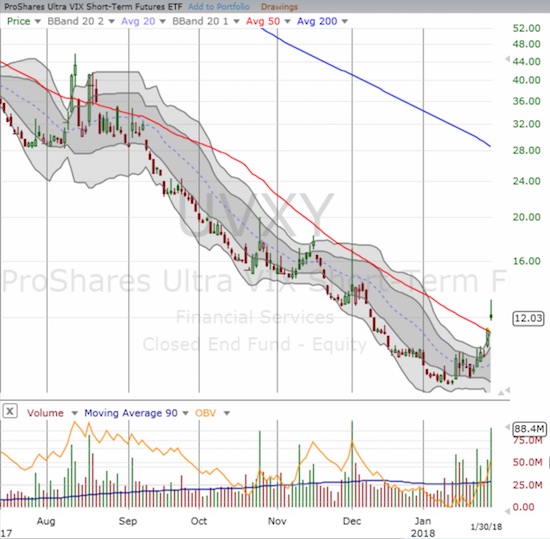
ProShares Ultra VIX Short-Term Futures (UVXY) has finally come alive again. Recent history suggests this is the beginning of the end of the latest rally.
AT40 (T2108), the percentage of stocks trading above their respective 40DMAs, fell hard enough to close at 55.9%. My favorite technical indicator has not been this low since mid-December. It is tempting to switch my trading call to bearish given AT40 completed two 1-day trips into overbought territory in less than 2 weeks: the failure to hold overbought conditions can be a sign of buyer exhaustion. However, the price action has been too strong to warrant such a rapid switch. I am sticking to the 2735 dividing line for the S&P 500, and treating the pullback as a time to refresh the shopping list.
STOCK CHART REVIEWS
iShares US Home Construction ETF (ITB )
Home builders are high on my shopping list. Suddenly, these stocks have delivered the dip that I concluded was unlikely to come during this seasonally strong period. The stock market’s jitters came just as important housing data missed “expectations” and thus greased the skids of homebuilder stocks. ITB fell hard enough this week to go negative year-to-date; the index for home builders is suddenly severely underperforming the S&P 500.
I started the latest buying with call options on ITB. On my shopping list are Century Communities (CCS) – testing 50DMA support, KB Home (KBH) – testing 50DMA support, Toll Brothers (TOL) – 50DMA breakdown and reversed post-earnings recovery, Tri Pointe Group (TPH) – below the close from the day of angst over the tax plan, Meritage Homes (MTH) – reversed almost all its gains since the tax plan angst, and Lennar (LEN) – down 11.1% from its recent high and just below its 50DMA. I am most interested in the stocks that survive key technical challenges. In breakdown cases, I want to see a test of 200DMA support and/or a recovery above the 50DMA. My list could change as technical and earnings events unfold. I will write in more detail in the next Housing Market Review which will include a close look at the latest round of housing data.
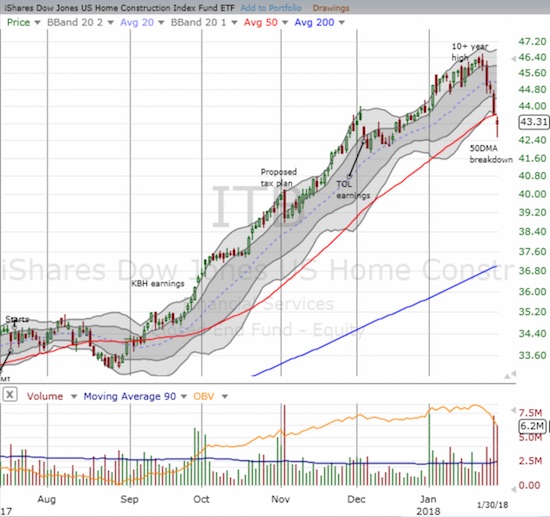
iShares US Home Construction ETF (ITB) is suddenly down fractionally for the year and severely underperforming the general stock market.
Chipotle Mexican Grill (CMG )
CMG was hit yet again with news of illnesses supposedly originating at its restaurants. I decided enough is enough: I sold my shares and took my remaining profits. I will keep an eye on the stock as always, but there are much easier ways to make money in the stock market than trying to dance around CMG’s landmines.
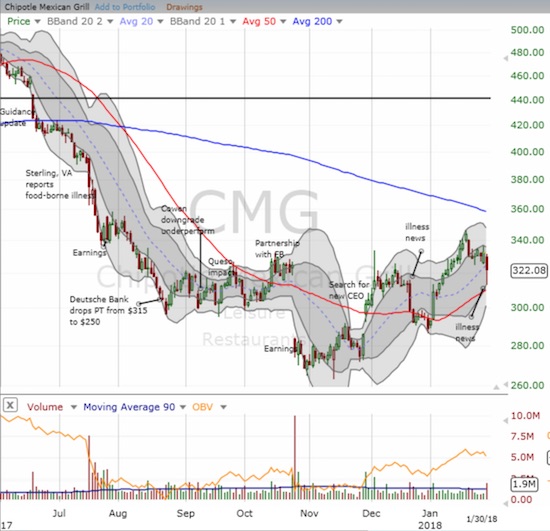
Chipotle Mexican Grill (CMG) lost 3.1% on another bad news day. The stock bounced sharply from the lows which retested 50DMA support.
Health Care Select Sector SPDR ETF (XLV)
“Amazon panic” struck again. This time, it came with the added force of JP Morgan (JPM) and Berkshire Hathaway (BRK-A). The three companies are joining forces to battle the high cost of healthcare to their vast businesses by offering services without concern for profits. XLV gapped down at the open, and I quickly bought a few put options.
In all the other cases of Amazon panic I have covered, I looked for the buying opportunity and (eventually) received rewards. In THIS case, I think the offending news will carry a lot of weight because of the financial resources aligned against the industry and the potential for this news to start a greater movement. At the very least, it will be hard for XLV, and particularly certain companies in the index, to regain former momentum and make new highs anytime soon. So, I am definitely not looking to buy the dip here…which is still relatively shallow right now anyway.
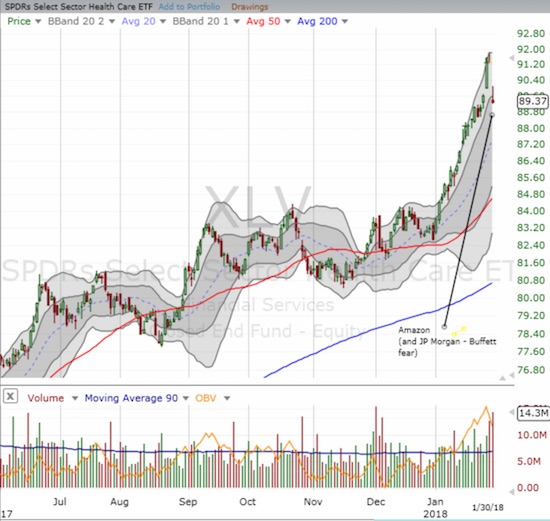
Health Care Select Sector SPDR ETF (XLV) may have topped out as its steep, primary uptrend came to an abrupt end on big news.
“Above the 40” uses the percentage of stocks trading above their respective 40-day moving averages (DMAs) to assess the technical health of the stock market and to identify extremes in market sentiment that are likely to reverse. Abbreviated as AT40, Above the 40 is an alternative label for “T2108” which was created by Worden. Learn more about T2108 on my T2108 Resource Page. AT200, or T2107, measures the percentage of stocks trading above their respective 200DMAs.
Active AT40 (T2108) periods: Day #485 over 20%, Day #299 over 30%, Day #99 over 40%, Day #47 over 50%, Day #1 under 60% (ending 37 days over 60%), Day #5 under 70%
Daily AT40 (T2108)

Black line: AT40 (T2108) (% measured on the right)
Red line: Overbought threshold (70%); Blue line: Oversold threshold (20%)
Weekly AT40 (T2108)

*All charts created using freestockcharts.com unless otherwise stated
Be careful out there!
Full disclosure: long UVXY puts, long ITB call options, long KBH call spread, long XLV puts
Follow Dr. Duru’s commentary on financial markets via more


