
The S&P 500 In Week 3 Of October 2016
In the third full week of October 2016, the S&P 500 ended higher than it closed in Week 2 of October 2016.
And yet, the week had something of a downcast to it, as can be seen in our alternative futures chart.
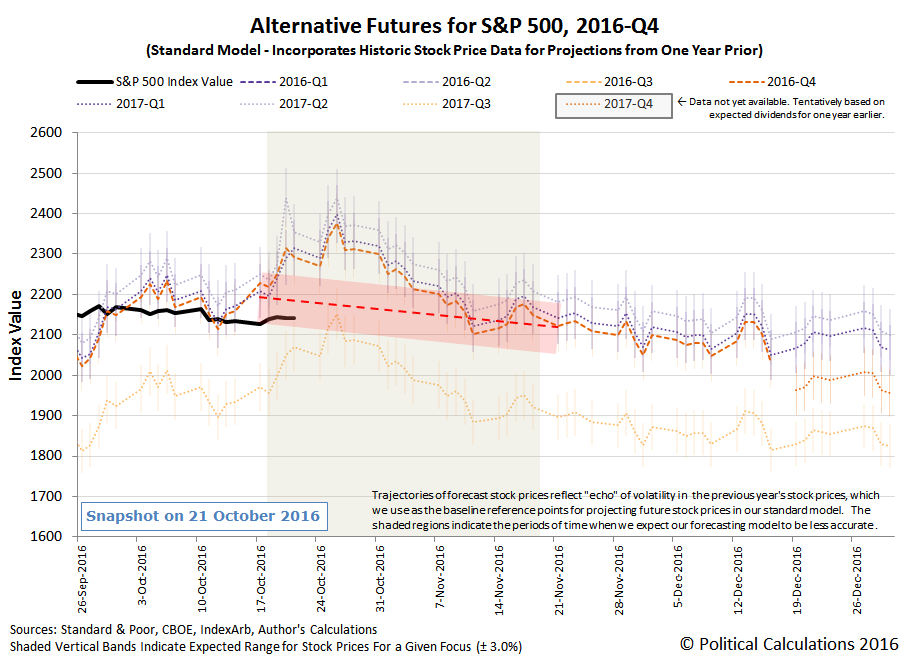
As expected, our futures-based model's projections of the alternate paths the S&P 500 would be likely to take based on how far forward in time investors are looking was off target, which is a result of our standard model's use of historic stock prices as the base reference points from which it projects future stock prices. In this case, the indicated trajectories for the period from 18 October 2016 to 21 November 2016 represents an echo of the noisy volatility that the S&P 500 experienced a year ago.
However, our "connect-the-dots" method of compensating for the echo effect to improve the accuracy of our forecast trajectory appears to be working - at least through the first several days in which we would need it to!
But it will need to continue working over the next four weeks for it to be really worthwhile. Until then, we suspect that how we visualized the connected dots trajectory in the chart above is what really gives the week its downcast feel.
Speaking of which, here are the headlines that caught our attention during Week 3 of October 2016.
Monday, 17 October 2016
- Over the weekend: Fed's Fischer: downshift in potential means 'not that simple' to raise rates - on Monday: Fed 'very close' to employment, inflation goals: Fischer
- Boston Fed's Rosengren maps case for a dove's rate hike
- Oil ends lower on U.S. trade spike; shale decline limits losses
- Wall Street slips as energy, consumer stocks drag
Tuesday, 18 October 2016
- Rising gasoline, rents push U.S. inflation higher in September
- Wall St. rallies as S&P seen snapping earnings decline
Wednesday, 19 October 2016
- Oil rises after surprise drop in U.S. inventories; stocks tick up
- Fed's Kaplan sees gradual rate hike appropriate
- Oil, earnings lift Wall Street but Intel drags
Thursday, 20 October 2016
- Oil down 2 percent, strong dollar knocks U.S. crude off 15-month highs
- Wall Street dips as telecoms slump; AmEx surges
Friday, 21 October 2016
- S&P, Dow fall with health stocks; Microsoft lifts Nasdaq
- A Fed's Williams Trifecta! Fed's Williams says 'this year would be good' for rate increase, Fed's Williams wants rate hike this year as wages rise, and also Fed is trying to make policy as predictable as possible: Williams
- Wall Street ends little changed; Microsoft hits record
Barry Ritholtz succinctly summarizes the positives and negatives of the week's market and economic news.
Disclosure: None.


