
Housing Market Review – A Struggling Flicker As New And Existing Home Markets Diverge
I saw a flicker of hope for home builders in the last Housing Market Review. Traders decided to snuff that flicker out very quickly afterward. Breakouts transformed into new tops and now the struggling flicker comes from home builder stocks holding support. The short-term path ahead looks like chop at best, especially with the latest round of earnings bounces receiving quick fades. Investors are essentially following a playbook that runs independent of almost anything the home builders say.
Lennar (LEN) broke down to a 16-month low ahead of its last earnings report as investors rushed to get out the way. LEN’s report was as strong as usual, and the stock gapped up yet again. And again, sellers rushed in to fade the post-earnings pop. THIS time, sellers failed to follow-through; the stock closed the last week at a post-earnings high on top of a fresh breakout above resistance at its 50-day moving average (DMA). If LEN can actually surpass the May high, the stock will finally position itself for the small run to or past 200DMA resistance that some speculators (like on CNBC’s Fast Money) keep anticipating.
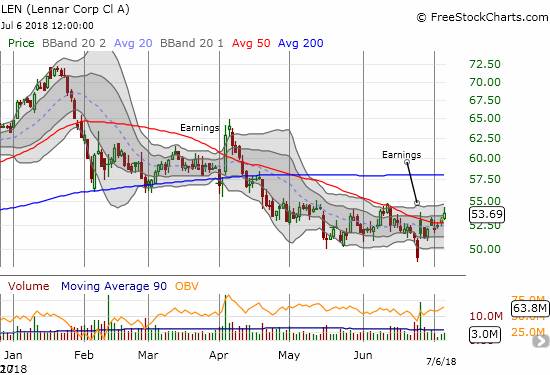
Lennar looks like it is finally bottoming but can it make the long-anticipated run to or past 200DMA resistance?
KB Home (KBH) was trading just above its 9-month low ahead of its latest earnings report. The post-earnings move was a bullish gap up that easily cleared 50DMA resistance. Sellers went right back to work the following day and almost filled the gap. KBH crawled back above its 50DMA, but buyers still have a lot to prove: they need to push KBH to a new post-earnings high.
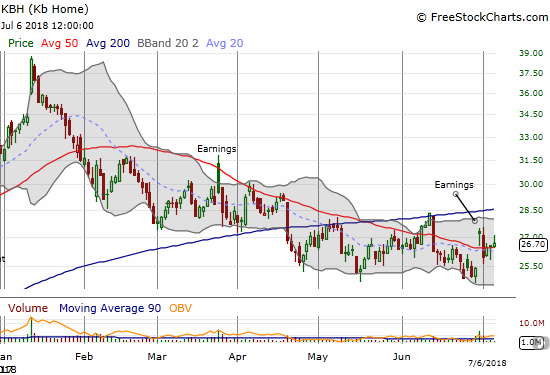
KB Home is clinging to a post-earnings gain as its 50DMA continues to serve as a pivot line.
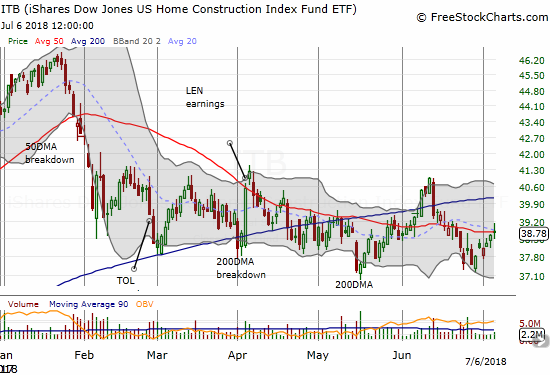
Net-net, home builders are going absolutely nowhere. The iShares US Home Construction ETF (ITB) is trading right in the middle of the trading range that has dominated trading since the February sell-off.
Source for charts: FreeStockCharts.com
The iShares US Home Construction ETF is churning in a trading range full of false hopes and close calls. ITB is stuck despite a near uniform voice from home builders about the strength of the market. Did the run-up to the January highs anticipate all the good news left for the time being in this cycle or do the current troubles telegraph worse conditions ahead? The housing data are mixed with growing weakness in existing home sales while new homes are looking strong again in starts and sales. Home builder sentiment sits in the middle with an apparent peak already in place for now.
Housing starts surged and left no doubt that home builders remain steadfastly confident as ever in the market even if investors and traders are not.
Single-family housing starts for May were revised significantly upward from 894,000 to 901,000, a second straight month of significant upward revisions. May starts increased month-over-month by 3.9% to 936,000. On an annual basis, single-family housing starts SURGED 18.3%. This sudden spike higher has put a definitive end to the deceleration trend from previous months. Recall that February’s 2.6% year-over-year increase was the smallest annual gain since October, 2017 at 1.8%.
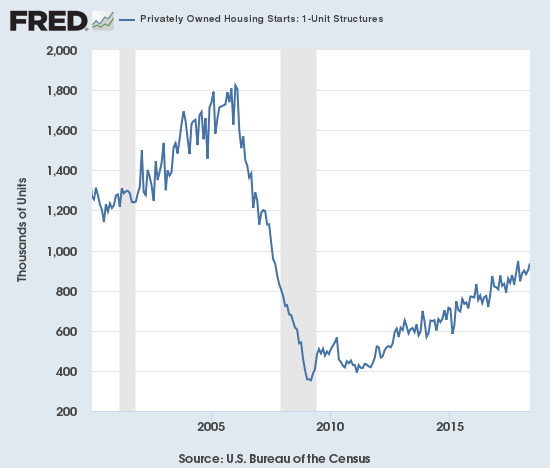
Source: US. Bureau of the Census, Privately Owned Housing Starts: 1-Unit Structures [HOUST1F], retrieved from FRED, Federal Reserve Bank of St. Louis, June 19, 2018.
Housing starts picked up the pace. The uptrend looks very secure again as well.
Over the previous 8 months, regional year-over-year changes in starts exhibited wide dispersion. For May, housing starts were very strong across the board. The Northeast, Midwest, South, and West each gained 18.2%, 12.2%, 22.6%, and 13.7% year-over-year respectively in May.
Slowing sales for existing homes are likely helping to dampen the mood for the stocks of home builders even though limited inventories continue to be the dominant story constraining existing home sales.
The February existing sales numbers ended a 2-month sales decline and softened a bit my alarm bells. In March, monthly sales continued to increase, but the year-over-year change was a decrease. For April, both monthly and year-over-year changes were declines. May recorded similar declines and put existing home sales right back in “yellow” cautionary territory.
The routine description for existing sales is usually sales decline because of a shortage of inventory and sales increase in spite of inventory shortages. While the National Association of Realtors (NAR) pulled the inventory card yet again, it also made a point to combine that lament with warnings about affordability: “Closings were down in a majority of the country last month and declined on an annual basis in each major region…Incredibly low supply continues to be the primary impediment to more sales, but there’s no question the combination of higher prices and mortgage rates are pinching the budgets of prospective buyers, and ultimately keeping some from reaching the market.”
The NAR attributed February’s sales gains to a “seasonal” jump in inventory. In the April press conference the NAR noted that new listings were up year-over-year and optimistically projected that inventory could actually increase year-over-year in late summer or fall. The NAR strained to get encouragement from May’s slight increase in inventory by noting that May, 2017 saw a decline in inventory. In other words, there is some reason to think the tide is ever so slightly starting to turn. This optimism is definitely a stretch when a decline in sales pace is likely responsible for a good amount of the inventory increase.
In the press conference, the NAR offered some ideas for increasing inventory: consider repurposing buildings like newly vacant shopping malls, streamlining local government permitting and environmental reviews. The NAR is now pleading with the market to correct itself. The frustration is understandable since transactions are the lifeblood of realtors.
The seasonally adjusted annualized sales in May of 5.43M was down 0.4% month-over-month from 5.45M in sales for April (downwardly revised from 5.46M). Year-over-year sales decreased 3.0% and once again stayed consistent with the current trend of decelerating existing home sales.
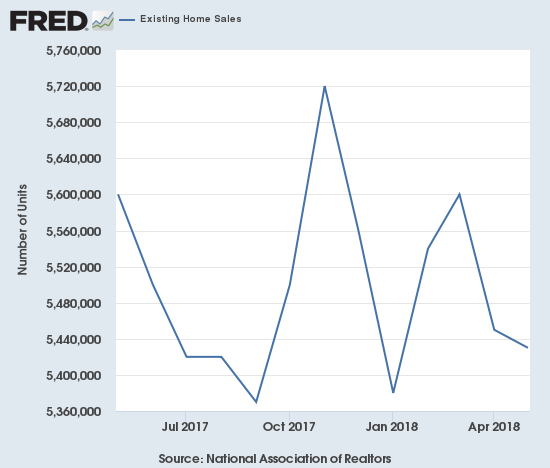
Source for chart: National Association of Realtors, Existing Home Sales© [EXHOSLUSM495S], retrieved from FRED, Federal Reserve Bank of St. Louis, July 4, 2018.
The on-going decline in existing home sales makes 2018’s Spring selling season a bust.(As of the March, 2018 data, the NAR further reduced historical data to just 13 months. For historical data from 1999 to 2014, click here. For historical data from 2014 to 2018, click here)
The share of sales going to first-time buyers decreased to 31%. This share was 33% in April, 30% in March, 29% in February and November was 33%. So while the NAR raised another alarm about first-time buyers – “The abrupt hike in mortgage rates this spring, along with price appreciation and competition being the strongest in the entry-level part of the market, is why first-time buyers are not as active as they should be and their participation remains below its historical average” – I think there is a lot more noise than signal in these data. The share is just bouncing around. Recall that September was the first time in two years where the share dropped below 30%.
The average share for first-time homebuyers for 2016 was 35%. The NAR’s 2017 Profile of Home Buyers and Sellers reported an average of 34% for 2017. Investors purchased 15% of homes in May, the same as February through April and down from 16% a year ago. Investor sales averaged a share of 15% in 2017 and 14% in 2016.
The absolute level of inventory of existing homes fell year-over-year for the 36th straight month. By contrast, inventory increased from April to May by 2.8%, a FIFTH straight monthly increase. The NAR noted in its February press conference that inventory “always” increases after the Christmas holiday. However, I think I was correct in suspecting that this increasing trend looks like more than post-holiday effects. The trend is also consistent with the NAR’s expectation of a potential inventory inflection point later this year. For contrast, recall that during its June, 2017 press conference, the NAR talked about a housing crisis in supply in some housing markets. For now the supply crisis continues to run deep at 4.1 months of supply at the current sales rate, down from 4.2 a year ago. The 1.85M homes for sale represents a 6.1% decrease from the previous April.
Existing home sales failed to increase across all regions with three declining outright: Northeast -11.7%, Midwest -2.3%, South 0.0%, West -4.1% year-over-year. As usual, regional sale fluctuations had no relationship to the on-going price run-ups. The Northeast provided a surprising exception to the typical story of substantial jumps in median prices (I cannot even remember when a region recorded a decline): Northeast -1.8%, Midwest 4.2%, South 4.5%, West 4.1%.
May’s 4.9% year-over-year increase in the overall median price of an existing home delivered the 75th consecutive month with a year-over-year increase. The median price of $264,800 is significantly higher than April’s $257,900 and is a second straight new all-time high. Unlike the previous month, the NAR acknowledged this record.
Single-family sales declined 0.6% on a monthly basis and decreased on a yearly basis by 3.0%. The median price of $267,500 was up 5.2% year-over-year.
During the April press conference, the NAR provided an update on the impact of tax reform on existing home sales. The NAR observed that fewer and fewer people are expressing concern about the limits on the mortgage tax deduction. However, they ARE starting to worry about increasing interest rates. In May’s conference call, the NAR pointed out that higher rates do have a real cost impact on top of price increases: the average homeowner’s mortgage has gone from $1072 to $1190 per month, an 11% increase. The NAR pointed out that wages have certainly not gone up this much.
June’s press conference piled on to the ominous notes. In addition to the fresh warnings on affordability, the NAR referenced the 2018 report of Harvard’s Joint Center for Housing Studies to lament that the housing market is becoming one of haves and have-nots. Of course, this dichotomy has long been an issue; I used the same report from four years ago to point out impacts of affordability problems. The NAR even surfaced the unique issues minorities are facing affording a home. The NAR warned that housing affordability is almost becoming a crisis.
The NAR’s tone continues to deteriorate ever so subtly with each passing month even as it stretches to look for the positives.
In February, new home sales barely eked forward. New home sales were resurgent in March. April sales did not keep pace on a monthly basis but delivered a strong year-over-year performance. In a stark contrast to existing home sales, new home sales in May surged on a monthly and year-over-year basis.
The Census Bureau revised April sales of new single-family homes downward from 662,000 to 646,000, a second straight month with a sizable downward revision. New home sales for May increased 6.7% month-over-month and increased 14.1% year-over-year to 689,000. Year-over-year gains have regularly hit double digits since 2012; November’s 26.6% jump was the highest since February, 2015 when new home sales soared 29.8% year-over-year. May breaks a string of four months of single-digit gains which represented a concerning deceleration in new home sales.
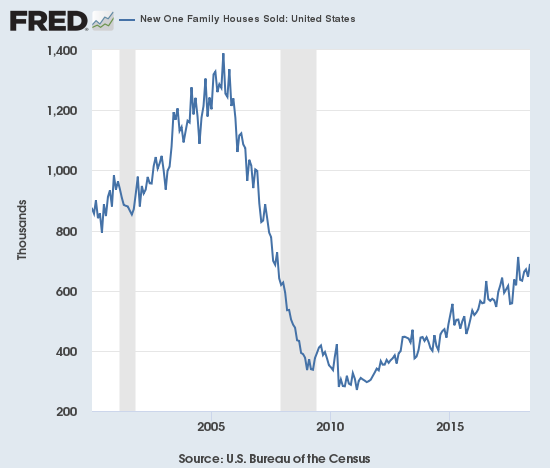
Source: US. Bureau of the Census, New One Family Houses Sold: United States [HSN1F], retrieved from FRED, Federal Reserve Bank of St. Louis, July 5, 2018.
New home sales are streaking higher again as a new post-recession high comes into sight.
In December, the inventory of new homes dropped to 5.2 months of supply. A market for homes is in balance at 6 months of supply. February’s inventory stood at 5.9 months. March’s inventory dropped back to 5.2 months. April’s inventory sat at 5.4 months worth of sales, and May dropped back to 5.2. Note well how declining inventory does not coincide with tightly constrained sales as what happens with existing home sales.
March’s revised median price of $335,400 was a 4.3% year-over-year gain. The revised average sales price of $366,000 was a 4.8% year-over-year decline so lower-priced new homes well outpaced the sales of high-priced new homes. For April, higher-priced homes surged back. April’s median price of $312,400 was a mere 0.4% gain, but the average price soared 11.3%. May’s median price of $313,000 was an actual year-over-year decline. The average price also declined 2.6% year-over-year.
On a regional basis, new home sales exhibited divergence with just two regions carrying the load for May. After a string of very strong gains since August, the Northeast finally ran out of gas in January with a 44.2% year-over-year plunge. For February the Northeast returned to gains with an 8.8% jump only to plunge again 52.5% in March. For April, the Northeast scraped out a 5.3% gain. For May, the Northeast fell again this time by 16.3%. The Midwest soared in April by 26.4% and soared again in May by 40.3%. The South gained 19.2% year-over-year. The West cooled off from January’s blistering 33.2% year-over-year gain to gain 3.1% year-over-year for February. The West heated up again in March with a 24.7% jump. The West stayed hot in April with an 18.9% gain in sales. For May, the West cooled off again by eking out a 0.6% gain.
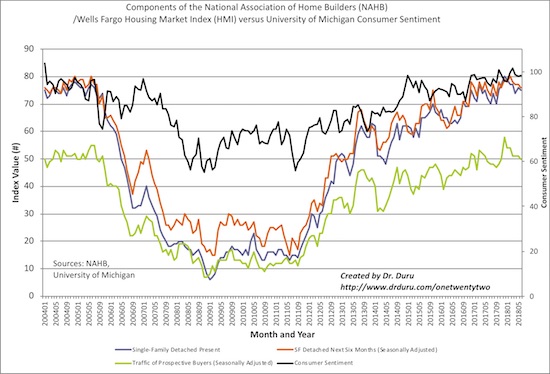
In the April housing market review, I explained why I would not have thought much of March’s slight decline in the Housing Market Index (HMI). At 70, the HMI was still higher than it was for most of 2017. For April, the HMI declined yet again, that time by two points to 68 (revised downward by a point). The HMI popped back up to 70 in May only to fall back to 68 for June. Each of the components of the HMI dropped by a point. Together, these components show a pattern of languishing in 2018 although they are all still at relatively high levels.Home Builder Confidence: The Housing Market Index – June, 2018
The statement from the NAHB in May was very positive with a big caveat for rising prices. For June, NAHB made an even bigger issue of lumber prices by shining a spotlight on trade actions that have driven those prices higher.
“Builders are optimistic about housing market conditions as consumer demand continues to grow. However, builders are increasingly concerned that tariffs placed on Canadian lumber and other imported products are hurting housing affordability. Record-high lumber prices have added nearly $9,000 to the price of a new single-family home since January 2017.”
Source: NAHB
The components of the Housing Market Index (HMI) continue to languish in 2018 and suggest that the HMI has topped out for the time being. Even more telling is an NAHB May article titled “Number of Builders Reporting a Shortage of Framing Lumber Surges.” The 31% of builders reporting shortages in framing lumber is the highest since the NAHB started asking the question in 1994. This percentage is the highest of any material since 2006 when the housing boom was at a peak and stretching availability of several building materials. The NAHB pointed out the harmful impact of President Trump’s trading policies:
“It is probably not a coincidence that the top five items on the 2018 shortage list are made of softwood lumber or steel, both of which have been targeted by the Administration with new import tariffs over the past year.”
While the overall HMI decreased, the Northeast and West HMIs increased by 5 and 1 point respectively. The Midwest declined by 3 points. The South declined by 2 points.
Parting thoughts
A lot of stories about housing crises, affordability issues, and gentrification caught my attention over the past month. For example, the Atlanta Journal-Constitution (AJC) posted an opinion piece about the increasing expense of living in Atlanta: “Torpy at Large: ‘Homes from the $500s!’ So, where do regular folks go?” The author wondered like many Atlantans who are these people who can afford such relatively expensive homes. I read a foreboding sense of displacement.
As another example, The Economist posted a very interesting, alternative view of gentrification in a piece titled “In praise of gentrification.” The author demonstrated that concept of static neighborhoods runs counter to principles of inclusion and diversity. The piece even showed data on certain situations where poor homeowners have benefited from the increased value of their neighborhoods. Gentrification is a very contentious topic that deserves even more attention. There are a lot of extreme voices in the debate and not enough in the middle where I think workable compromises exist.
On the positive side, Marketplace produced a story describing how younger home buyers are figuring out how to land their first homes.
Finally, I have not paid enough attention to the real estate companies that make money on facilitating market transactions. I finally bought some Redfin (RFIN), and I am constantly looking for an (re)entry on Zillow Group (ZG). Marketplace interviewed the CEO who introduced the concept of the company as a “real estate media company.” This is basically a way of dressing up the ad-based revenue model of the company:
“…we have all this incredible information, it empowers consumers, and then we make money by selling ads. So we’ll do about a billion and a half of revenue this year and it’s advertising driven. So when you’re looking at a home for sale, you’ll see a couple buyers’ agents next to that listing, and those are agents that are paying us to show up there and try to help you buy that house.”
Disclosure: long ITB calendar call spread, long RDFN
Follow Dr. Duru’s commentary on financial markets via more


