
Housing Market Review – Dissonance: Decelerating Housing Data And Diverging Home Builder Stocks
The last Housing Market Review covered data reported in February, 2018 for January, 2018. At the time, I connected the dots on the bearish implications of converging technicals and fundamentals. The iShares U.S. Home Construction ETF (ITB) broke down below its 200-day moving average (DMA) in a very bearish move. Yet, the very next day, buyers stepped in and took ITB above its 200DMA again. The day after that relief, strong earnings from Lennar (LEN) sent the entire sector soaring in a move that seemed to shift the narrative back into a positive situation. LEN jumped 10.0% in a single day. LGI Homes (LGIH) jumped 8.6% going into its monthly sales report.
The positive shift was short-lived. While LGIH continues to hold up well, sellers quickly reversed all LEN’s gains and punched it down to a near 7-month low before the latest relief bounce. The selling in LEN and a few other builders was enough to push ITB right back to 200DMA support where it continues to pivot. With home builders continuing to tell a bullish story and the housing data chugging along with no dramatic changes, the technicals of the home builder stocks is showing a curious divergence. Clear winners and losers are emerging from the rubble of the on-going selling in the sector.
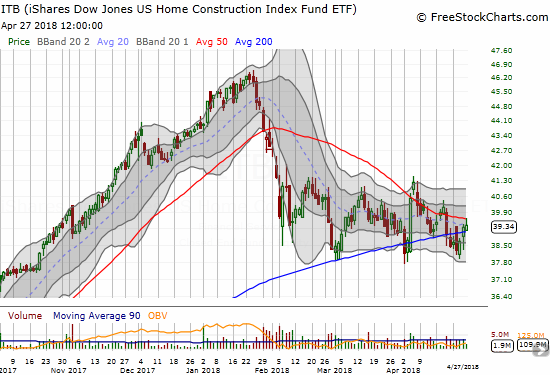
The iShares U.S. Home Construction ETF (ITB) is facing down a critical test as the pivot around 200DMA support converges with the downtrending resistance from the 50DMA.
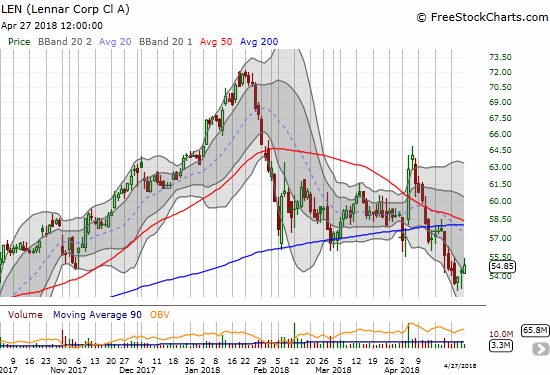
Lennar Corporation (LEN) could not hold 200DMA support even with a initially soaring response to its last earnings report. LEN is now in bearish territory.
The sharp rise in LEN allowed me to take profits on call options I held in the builder at the time. The LEN-driven bounce in ITB was so swift, I decided not to liquidate most of my home builder positions as planned. Instead, I went back into “buy-the-dip” mode. When LEN fell back to its 50DMA, I loaded up again on call options; that trade is clearly failing. I also decided to go one more round with KB Home (KBH). Once again, KBH disappointed as sellers resumed the pressure. KBH finally broke down below its 200DMA in last week’s sell-off. The volume was high and the close was damaging. KBH’s downtrending 50DMA is keeping a tight lid on the stock and represents the poor reward KBH is receiving for managing guidance higher.
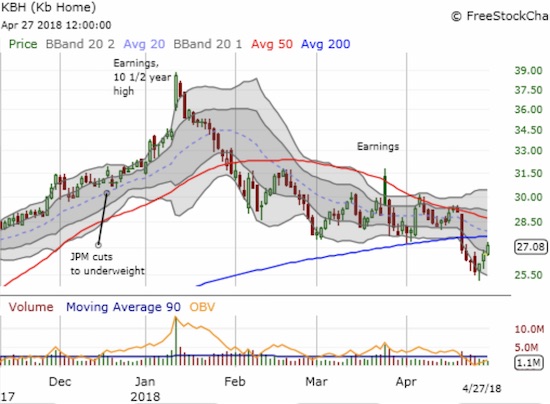
KB Home (KBH) entered bearish territory with a 200DMA breakdown. The stock is down 30.0% from its 10 1/2 year high and sits at a near 5-month low.
Pulte Home (PHM) is the latest great hope with the stock pushing to a near 3-month high off important 200DMA support. Recall that PHM investors were barely fazed by the swift one-day sell-off in the wake of news on the then proposed tax reform plan. The post-earnings rally that was underway going into that news resumed the next day. Yet, PHM sold off after reporting earnings on January 30th. The stock market’s February sell-off further greased the skids. Fortunately, PHM’s 200DMA has provided solid support even as sellers faded every attempted rally off that important trend line. Last week’s earnings report MAY have broken the pattern as the subsequent buying has propelled the stock right through the faders that have plagued the stocks of home builders for 3 months now.
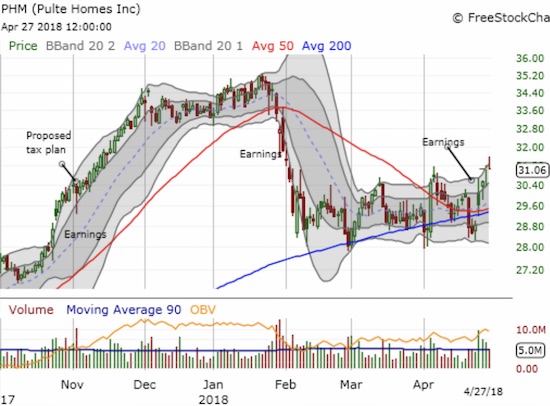
Pulte Home (PHM) is showing a sign of market strength increasingly precious in the housing sector: the stock is breaking out from a trading range well-supported by its 200DMA.
Even with the green shoots from PHM, I continue to temper my expectations. The housing data is not providing any fresh catalyst to drive sentiment and stocks higher. The assurances and bullish reports from home builders are impressing fewer and fewer investors. This setup marks the confirmed end of momentum in the housing market that went into 2018.
New Residential Construction (Housing Starts) – March, 2018
Single-family housing starts for February were revised slightly downward from 902,000 to 900,000. March starts decreased month-over-month by 3.7% to 867,000. On an annual basis, single-family housing starts increased 5.2%. This is a significant improvement from February’s 2.6% (revised) year-over-year increase which was the smallest annual gain since October, 2017 at 1.8%. However, the growth trend since last August still looks weak.
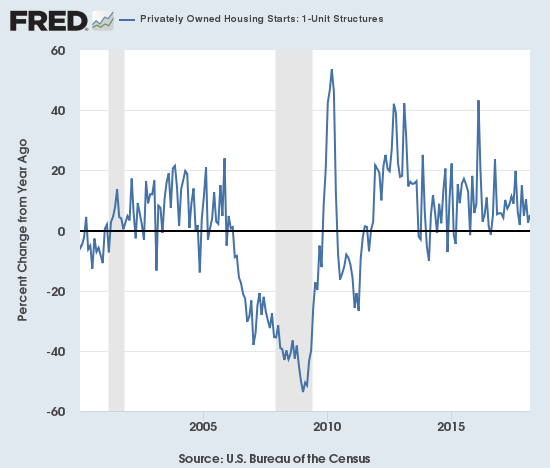
The annual change in housing starts has been trending downward since last summer, but at least the changes have not gone negative since summer of 2016.
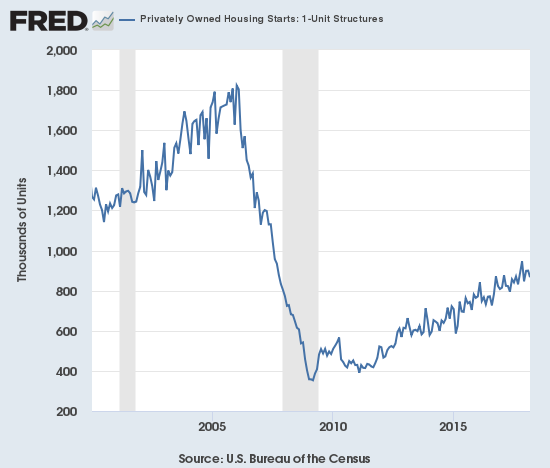
The upward trend in starts from the post-recession trough continues chugging away.
Source: US. Bureau of the Census, Privately Owned Housing Starts: 1-Unit Structures [HOUST1F], retrieved from FRED, Federal Reserve Bank of St. Louis, April 23, 2018.
Over the last seven months, regional year-over-year changes in starts have exhibited wide dispersion. The Northeast, Midwest, South, and West each changed -10.8%, 39.0%, -6.7%, and 21.3% year-over-year respectively in March. The West delivered very strong growth yet again as builders there continue rushing to serve a thirsting market.
Existing Home Sales – March, 2018
The existing home sales numbers for February, 2018 had a more favorable comparison than January given February, 2017 sales took a steep dive off what was a January, 2017 post-recession high. Still, the February existing sales numbers ended a 2-month sales decline and softened a bit my alarm bells. This time around, monthly sales continued to increase but the year-over-year change was a decrease.
The routine description for existing sales is usually sales decline because of a shortage of inventory and sales increase in spite of inventory shortages. Per the script, for March, the National Association of Realtors (NAR) started its report by observing: “Existing-home sales grew for the second consecutive month in March, but lagging inventory levels and affordability constraints kept sales activity below year ago levels…” The NAR attributed February’s sales gains to a “seasonal” jump in inventory. In the April press conference the NAR noted that new listings were up year-over-year and optimistically projected that inventory could actually increase in late summer or fall. Such an increase would mark a significant “inflection point” with inventory actually increasing year-over-year. The NAR also optimistically projected more new home construction as a result of more workers being attracted to construction with a 4% increase in wages and regulatory relief for small banks which are crucial for construction loans for smaller home builders. On the other hand, sellers of existing homes are starting to show a reluctance to move given the mortgage rates they face are higher than their existing mortgages.
The seasonally adjusted annualized sales of 5.60M were up 1.1% month-over-month from 5.54M in sales for February (no revisions). Year-over-year sales decreased 1.2% and thus stayed consistent with the current trend of decelerating existing home sales.
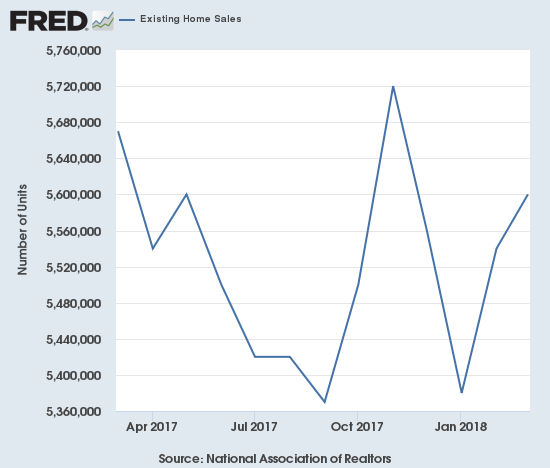
Existing home sales have rebounded in 2018 but are still slightly down year-over-year.
(As of the March, 2018 data, the NAR further reduced historical data to just 13 months. For historical data from 1999 to 2014, click here. For historical data from 2014 to 2018, click here)
Source for charts: National Association of Realtors, Existing Home Sales© [EXHOSLUSM495S], retrieved from FRED, Federal Reserve Bank of St. Louis, April 26, 2018.
The share of sales going to first-time buyers increased to 30%. This share was 29% in February and November and was 32% a year ago. Recall that September was the first time in two years where the share dropped below 30%. The NAR warned in last month’s report that “Realtors® in several markets note that entry-level homes for first-timers are hard to come by, which is contributing to their underperforming share of overall sales to start the year.”
The average share for first-time homebuyers for 2016 was 35%. The NAR’s 2017 Profile of Home Buyers and Sellers reported an average of 34% for 2017. Investors purchased 15% of homes in March, the same as February but down from 18% a year ago. Investor sales averaged a share of 15% in 2017 and 14% in 2016.
The absolute level of inventory of existing homes fell year-over-year for the 34th straight month. By contrast, inventory increased from February to March by 5.7%, a THIRD straight monthly increase. The NAR noted in its February press conference that inventory “always” increases after the Christmas holiday. However, I think this increasing trend looks like more than post-holiday effects supports the NAR’s expectation of a potential inventory inflection point later this year. Recall that during its June, 2017 press conference, the NAR talked about a housing crisis in supply in some housing markets. For now the supply crisis continues to run deep at just 3.6 months of supply at the current sales rate.
The 1.67M homes for sale represented a 7.2% decrease from the previous February. The string of year-over-year declines is remarkable: for example, starting from 2016…August -10.1%, September -6.8%, October -4.3%, November -9.3%, December -6.3%, January -7.1%, February -6.4%, March -6.6%, April -9.0%, May -8.4%, June -7.1%, July -9.0, August -6.5%, September -6.4%, October -10.2%, November -9.7%, December -10.3%, January -9.5%, February -7.2%. These are the declines of an increasingly dysfunctional market. If an inflection point comes later this year, it will deliver a VERY significant change in market dynamics.
The regional story on existing home sales was split exactly in half: Northeast -9.3%, Midwest -1.5%, South 0.4%, West 0.8% year-over-year. As usual, regional sale fluctuations had no relationship to the on-going price run-ups. Indeed, inventory improvements did not prevent price hikes. Each region once again logged notable to substantial year-over-year jumps in median prices: Northeast 3.3%, Midwest 5.1%, South 5.7%, West 7.9%.
March’s 5.8% year-over-year increase in the overall median price of an existing home delivered the 73rd consecutive month of year-over-year increases. The median price of $250,400 is significantly higher than February’s $241.700. The last record median price was set in August, 2017 at $253,500.
Single-family sales increased 0.6% on a monthly basis and decreased on a yearly basis by 1.0%. The median price of $252,100 was up 5.9% year-over-year.
During the press conference, the NAR provided an update on the impact of tax reform on existing home sales. The NAR observed that fewer and fewer people are expressing concern about the limits on the mortgage tax deduction. However, they ARE starting to worry about increasing interest rates.
New Residential Sales – March, 2018
In February, new home sales barely eked forward. New home sales were resurgent in March.
The Census Bureau revised February sales of new single-family homes significantly upward from 622,000 to 667,000, a second month in a row with a sizable upward revision. New home sales for March increased 4.0% month-over-month and increased 8.8% year-over-year to 694,000. Year-over-year gains have regularly hit double digits since 2012; November’s 26.6% jump was the highest since February, 2015 when new home sales soared 29.8% year-over-year. The return to single-digit gains over the last three months is consistent with the decelerations in housing starts and existing home sales. At least the uptrend from the post-recession trough looks firmly intact again.
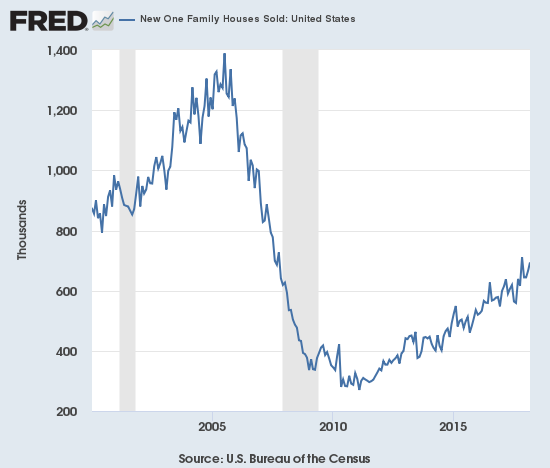
New home sales continue to trend upward even as the growth profile weakens a bit.
Source: US. Bureau of the Census, New One Family Houses Sold: United States [HSN1F], retrieved from FRED, Federal Reserve Bank of St. Louis, April 28, 2018.
In December, the inventory of new homes jumped to 5.7 months of supply and ended several months of imbalance. A market for homes is in balance at 6 months of supply. February’s inventory stood at 5.9 months. March’s inventory dropped back to 5.2 months.
In December, the median price of a new home stood at $335,400, a 2.4% year-over-year gain. January’s median price of $323,000 was a decline from December but still a 2.5% year-over-year gain. February’s median price of $326,800 was a year-over-year surge of 9.7%. The average price declined 1.6% so there was clearly a relative jump in lower-priced homes. March’s median price of $337,200 is a 4.8% year-over-year gain. The average sales price of $369,900 is a 3.8% year-over-year decline so lower-priced new homes well outpaced the sales of high-priced new homes.
On a regional basis, new home sales reached an extreme in divergence. After a string of very strong gains since August, the Northeast finally ran out of gas in January with a 44.2% year-over-year plunge. For February the Northeast returned to gains with an 8.8% jump only to plunge again 52.5% in March. This drop far outpaces existing homes, so it is hard to just blame this all on the unseasonably bad weather. The Midwest decreased 2.4%. The South gained 10.4% year-over-year. The West cooled off from January’s blistering 33.2% year-over-year gain to gain 3.1% year-over-year for February. The West heated up again in March with a 24.7% jump. The blistering pace of sales in the West helps explain the surge in housing starts in the region.
Home Builder Confidence: The Housing Market Index – April, 2018
In the previous housing market review, I explained why I would not have thought much of March’s slight decline in the Housing Market Index (HMI). At 70, the HMI was still higher than it was for most of 2017. For April, the HMI declined yet again, this time by one point to 69. In March the Traffic of Prospective Buyers dropped from 54 to 51 and reversed all its gains since November, 2017. In April, this component held steady while the other two fell. Given the Spring season is underway, I am assuming the HMI has peaked for now.
The NAHB reassured that the HMI is still “on firm ground.” The organization added tariffs to its list of caveats to its optimism (emphasis mine):
“Strong demand for housing is keeping builders optimistic about future market conditions. However, builders are facing supply-side constraints, such as a lack of buildable lots and increasing construction material costs. Tariffs placed on Canadian lumber and other imported products are pushing up prices and hurting housing affordability.”
Uncharacteristically, the NAHB attempted to explain away the small dip in the HMI: “The minor dip in builder confidence this month is likely due to lingering winter weather effects, which may be slowing housing activity in some pockets of the country.” I find it hard to believe that a temporary effect like weather could impact builder confidence.
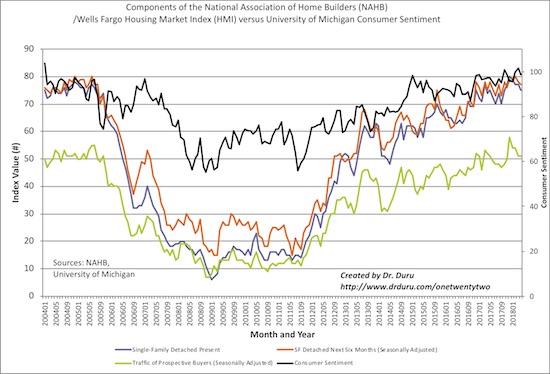
While the traffic of prospective buyers often comes off a winter peak going into the Spring selling season, the other two components of the Housing Marketing Index (HMI) look like they have topped. Similarly, consumer sentiment is not likely to gain much more given what now looks like a 4-year holding pattern.
Source: NAHB
While the overall HMI declined, the Midwest region stopped its steep decline by staying flat from March’s 64 reading. The Northeast managed to gain a point as it looks like it is stabilizing. The Midwest and Northeast readings give me even more reason to doubt the NAHB’s weather-related speculation to explain the April decline in the HMI. The South and the West declined two and one point respectively.
Parting thoughts
For this month’s parting thoughts, more blasts from Americans facing a variety of housing burdens. These are stark reminders that the limited supply of housing, its soaring cost, and the high hurdles for financing have very real and negative impacts on American households.
Rent Burdened
On April 19th, The Pew Charitable Trusts published a research report titled “American Families Face a Growing Rent Burden: High housing costs threaten financial security and put homeownership out of reach for many.” It is an extensive study of the demographics of rent-burdened households that describes the financial fragility experienced by a significant number of Americans. These are households who have little hope of ever saving up enough money to afford a home. Older Americans, mostly baby boomers, make up the largest group of new renters as the percentage of 65+ Americans who rent increased from 14% to 24% from 2001 to 2015. Pew reported that the percentage of renter households defined as rent burdened went from 32% to 38% from 2001 to 2015. Note that I did not see any account for changes in the constitution of these households. For example, the percent of renters among older Americans can increase because of divorces. The percent of rent burdened households can occur from lower rates of marriage and co-habitation.
Forty-three million U.S. households rented in 2015. Eleven million (26%) of those households are considered rent-burdened with seven million spending more than half their income on rent.
From the introduction:
“In the aftermath of the 2007-09 downturn, households that rent have been slower to transition to homeownership than they were before the recession and housing crisis…
…as more households rely on renting for their long-term housing needs, they are finding the cost of renting increasingly onerous. The steadily rising demand for rental properties over the past decade has reduced vacancy rates to near historic lows, fueling a rapid increase in rental market prices that has outpaced household incomes for many families.”
In other words, too many households are facing an inflationary trap where rapidly rising rents are compromising savings and the soaring price of homes is putting home ownership even further out of reach for this population.
Evicted
Households facing the greatest rent burdens eventually stare down eviction. On April 12th,
focused on the work of
. The Eviction Lab, based at Princeton University, built the country’s first comprehensive database on evictions. The database is open to the public for searching the number of evictions in any community. NPR interviewed sociologist Matthew Desmond, winner of a 2017 Pulitzer Prize for “Evicted: Poverty and Profit in the American City” about the time he spent doing field research living in impoverished communities. From the interview highlights:
“Incomes have remained flat for many Americans over the last two decades, but housing costs have soared. So between 1995 and today, median asking rents have increased by 70 percent, adjusting for inflation…
Only about 1 in 4 families who qualify for housing assistance get anything. So when we picture the typical low income American today, we shouldn’t think of them living in public housing or getting any kind [of] housing assistance for the government, we should think of folks who are paying 60, 70, 80 percent of their income and living unassisted in the private rental market.”
Homeless
With nowhere else to turn, households may end up on the streets. On April 20th, the state of California’s auditor released a report showing how California lagged the rest of the nation in taking care of the homeless population. From the AP news release:
“California has about 134,000 homeless people, roughly 24 percent of the nation’s total homeless population…
With 68 percent of its homeless people living in vehicles, abandoned buildings, parks or on streets, California has the highest rate of unsheltered homeless of any state.
Cities such as New York and Boston, by comparison, shelter more than 95 percent of the homeless population…
Additionally, 82 percent of California’s homeless youth are unsheltered, compared to 38 percent in the rest of the nation.”
Those are pretty stark numbers that are even more dire when contrasted to the ever-growing crisis in housing in California that I have chronicled in earlier Housing Market Reviews.
Be careful out there!
Disclosure: I am long KBH and LEN calls.
Follow Dr. Duru’s commentary on financial markets via more


