
Decred Analysis – Testing The Down Trendline

Last day in this week starts for us with the analysis of Decred. Previously, this coin was analyzed by us on the 6th of July. Back in that day, the trend was bearish and we saw a great chance for a further drop. The price was around 62 USD but we were more than sure that those high levels will not hold and we should see this coin much lower:
„After the breakout of the lower line of the pennant(red), there is only one direction and it is south. The sell signal will be denied, once the price will climb back above the green line, which for now, is less likely to happen. „
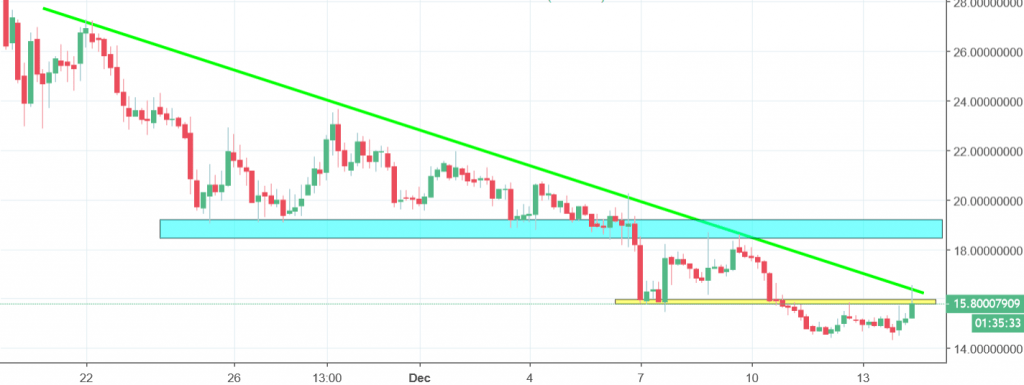
In this week, DCR reached new long-term lows around the 14 USD. How about that for a great analysis? As You can see, the value of this coin sunk. Today, DCR is one of the best coins on the market. Does that mean that the bullish reversal has started? Signals are so far mixed but we should get an answer soon. As for the bullish factors, we do have a rise and we are currently challenging the horizontal resistance marked with a yellow color. On the other hand, we are still in the down trend and the price is bouncing from the mid-term down trendline (green). In my opinion, the way to trade this is pretty simple. You buy, when the price will close a day above the green line and sell, when the price will close a day below the yellow line.


