
Bitcoin's Slippery Search For Fair Value
My last post on Bitcoin made reference to a bearish engulfing candle that had formed on the daily timeframe. Since then, its price drifted slightly upwards, then plunged and closed below the low of that candle on Friday, as shown on the following daily chart.
The momentum and rate-of-change indicators did not confirm the recent higher price high, but are both in an accelerating diverging downtrend, and are below their zero levels.
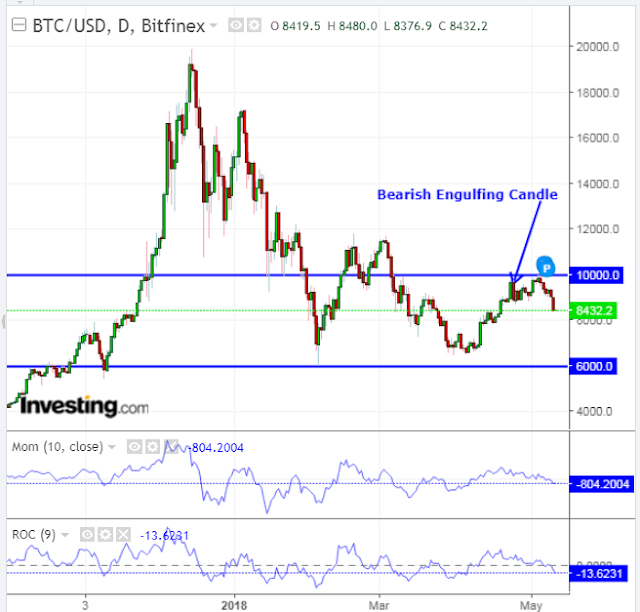
Bitcoin Daily
This week closed out on a bearish engulfing candle formation on the weekly timeframe, as shown below. Both the momentum and rate-of-change indicators are below their zero levels and have been drifting lower over the past few weeks.
Daily and weekly price action on Bitcoin reflects systematic, measured selling since it made its record high in mid-December 2017, and it has failed to stabilize since then. There is no indication that is about to change any time soon.
Rather, these charts paint a picture of a highly unstable cryptocurrency which experienced an initial frenzied parabolic rise, followed by high frothy volatility, and which has yet to find its fair value or prove that it has any at all.
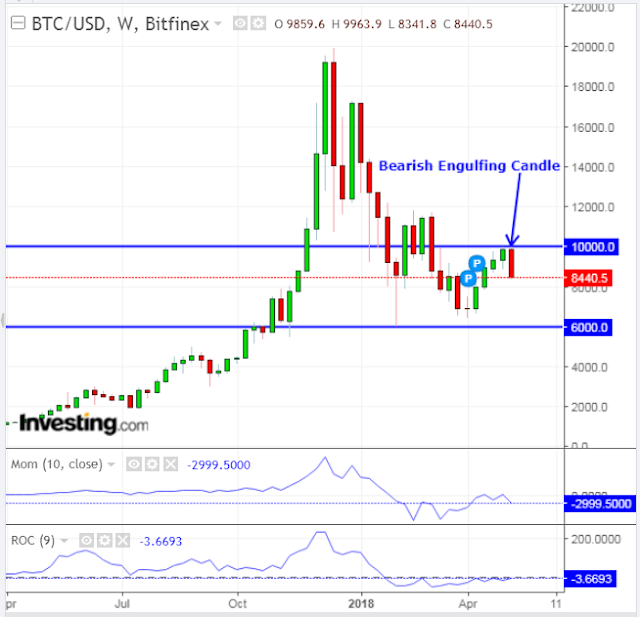
Bitcoin Weekly


