R Varb Blog | Correlation Between SPX And VIX | TalkMarkets
Quantitative trader
Volatility and options trading, statistical arbitrage in volatility space. We are a boutique financial service firm specializing in quantitative analysis, derivatives valuation and risk management. We combine the power of traditional structured finance with modern high performance computing ...more

Correlation Between SPX And VIX

Date: Sunday, May 20, 2018 7:12 AM EDT

In January, many traders noticed that there was a divergence between SPX and VIX. It’s true if we look at the price series. Graph below shows the 20-day rolling correlation between SPX and VIX prices for the last year. We can see that the correlation has been positive lately.

volatility arbitrage trading strategies

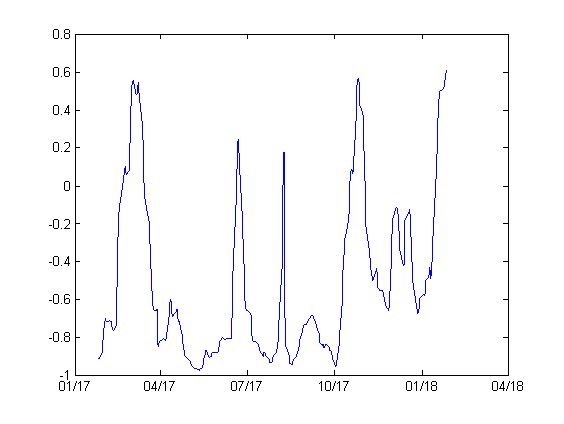
20-day rolling correlation SPX-VIX prices, ending Jan 26 2018

However, if we look at the correlation between SPX daily returns and VIX changes, it’s more or less in line with the long term average of -0.79. So the divergence was not significant.

volatility trading strategies based on correlation

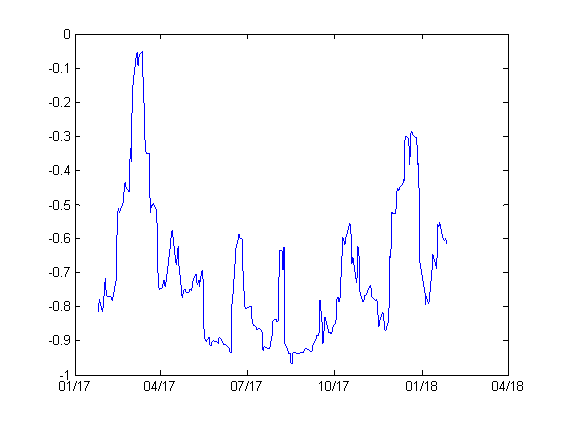
20-day rolling correlation SPX return -VIX changes ending Jan 26 2018

The implied volatility (VIX) actually tracked the realized volatility (not shown) quite well. The latter happened to increase when the market has moved to the upside since the beginning of the year.

See More Here: Correlation Between SPX and VIX

Disclaimer: This and other personal blog posts are not reviewed, monitored or endorsed by TalkMarkets. The content is solely the view of the author and TalkMarkets is not responsible for the content of this post in any way. Our curated content which is handpicked by our editorial team may be viewed here.

Comments

Leave a comment to automatically be entered into our contest to win a free Echo Show.