


VALUATION WATCH: Overvalued stocks now make up 47.08% of our stocks assigned a valuation and 15.41% of those equities are calculated to be overvalued by 20% or more. Nine sectors are calculated to be overvalued.
UPGRADES
--ValuEngine Top-Five BUY/STRONG BUY Upgrades
For today's bulletin we used our website's advanced screening functions to search for UPGRADES to BUY or STRONG BUY with complete forecast and valuation data. They are presented by one-month forecast return. Wabash National (WNC) is the leader here.
|
Ticker |
Company Name |
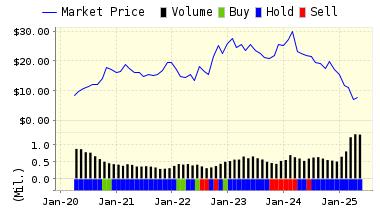
Market Price |
Valuation |
Last 12-M Return |
1-M Forecast Return |
1-Yr Forecast Return |
P/E Ratio |
Sector Name |
|
WNC |
WABASH NATIONAL |
14.18 |
-4.55% |
4.73% |
1.09% |
13.07% |
7.98 |
Auto-Tires-Trucks |
|
TPC |
TUTOR PERINI CP |
22.62 |
34.76% |
7.92% |
0.72% |
8.59% |
13.96 |
Construction |
|
JOUT |
JOHNSON OUTDOOR |
26.36 |
14.29% |
9.97% |
0.68% |
8.13% |
15.39 |
Consumer Discretionary |
|
AMGN |
AMGEN INC |
157.95 |
-10.93% |
1.08% |
0.62% |
7.46% |
14.55 |
Medical |
|
MTRX |
MATRIX SERVICE |
16.57 |
-9.64% |
-1.78% |
0.54% |
6.45% |
13.58 |
Oils-Energy |
Below is today's data on Wabash National (WNC):
Wabash National Corporation is one of the leading manufacturers of semi trailers in North America. Established in 1985, the company specializes in the design and production of dry freight vans, refrigerated vans, flatbed trailers, drop deck trailers, and intermodal equipment. Its innovative core products are sold under the DuraPlate, ArcticLite, and Eagle brand names. The company operates two wholly owned subsidiaries: Transcraft Corporation, a manufacturer of flatbed and drop deck trailers; and Wabash National Trailer Centers, a retail distributor of new and used trailers and aftermarket parts throughout the U.S. and Canada.
VALUENGINE RECOMMENDATION: ValuEngine updated its recommendation from BUY to STRONG BUY for WABASH NATIONAL on 2016-05-31. Based on the information we have gathered and our resulting research, we feel that WABASH NATIONAL has the probability to OUTPERFORM average market performance for the next year. The company exhibits ATTRACTIVE P/E Ratio and Price Sales Ratio.
|
ValuEngine Forecast |
||
|
Target |
Expected |
|
|---|---|---|
|
1-Month |
14.33 | 1.09% |
|
3-Month |
14.55 | 2.62% |
|
6-Month |
14.75 | 4.05% |
|
1-Year |
16.03 | 13.07% |
|
2-Year |
15.36 | 8.29% |
|
3-Year |
13.88 | -2.14% |
|
Valuation & Rankings |
|||
|
Valuation |
4.55% undervalued |
Valuation Rank(?) |
|
|
1-M Forecast Return |
1.09% |
1-M Forecast Return Rank |
|
|
12-M Return |
4.73% |
Momentum Rank(?) |
|
|
Sharpe Ratio |
0.12 |
Sharpe Ratio Rank(?) |
|
|
5-Y Avg Annual Return |
5.12% |
5-Y Avg Annual Rtn Rank |
|
|
Volatility |
41.56% |
Volatility Rank(?) |
|
|
Expected EPS Growth |
-9.57% |
EPS Growth Rank(?) |
|
|
Market Cap (billions) |
0.98 |
Size Rank |
|
|
Trailing P/E Ratio |
7.98 |
Trailing P/E Rank(?) |
|
|
Forward P/E Ratio |
8.83 |
Forward P/E Ratio Rank |
|
|
PEG Ratio |
n/a |
PEG Ratio Rank |
|
|
Price/Sales |
0.48 |
Price/Sales Rank(?) |
|
|
Market/Book |
5.08 |
Market/Book Rank(?) |
|
|
Beta |
2.22 |
Beta Rank |
|
|
Alpha |
0.04 |
Alpha Rank |
|
ValuEngine Market Overview
|
Summary of VE Stock Universe |
|
|
Stocks Undervalued |
52.82% |
|
Stocks Overvalued |
47.18% |
|
Stocks Undervalued by 20% |
22.79% |
|
Stocks Overvalued by 20% |
15.41% |
ValuEngine Sector Overview
|
Sector |
Change |
MTD |
YTD |
Valuation |
Last 12-MReturn |
P/E Ratio |
|
0.00% |
-1.00% |
5.65% |
8.40% overvalued |
-1.42% |
22.97 |
|
|
0.00% |
-0.37% |
4.92% |
8.21% overvalued |
1.72% |
24.01 |
|
|
0.00% |
-0.80% |
4.15% |
5.42% overvalued |
-8.45% |
17.46 |
|
|
0.00% |
-0.65% |
5.54% |
4.32% overvalued |
-9.41% |
20.80 |
|
|
0.00% |
-5.30% |
24.56% |
4.12% overvalued |
8.19% |
27.90 |
|
|
0.00% |
-3.03% |
12.32% |
1.87% overvalued |
-34.02% |
22.91 |
|
|
0.00% |
0.14% |
-2.63% |
1.41% overvalued |
-2.86% |
18.99 |
|
|
-0.04% |
1.39% |
7.09% |
0.59% overvalued |
-8.89% |
27.39 |
|
|
0.00% |
0.66% |
19.79% |
0.41% overvalued |
-4.34% |
21.20 |
|
|
0.00% |
1.90% |
10.66% |
0.89% undervalued |
-7.81% |
23.13 |
|
|
-1.75% |
1.33% |
2.71% |
0.90% undervalued |
-4.86% |
16.07 |
|
|
0.00% |
0.19% |
2.21% |
3.86% undervalued |
-10.40% |
21.80 |
|
|
0.00% |
-2.26% |
-1.18% |
5.75% undervalued |
-16.77% |
11.95 |
|
|
0.00% |
-1.39% |
-4.12% |
5.93% undervalued |
-19.53% |
27.70 |
|
|
0.00% |
-3.36% |
-3.42% |
11.19% undervalued |
-13.21% |
21.48 |
|
|
0.00% |
-3.48% |
0.55% |
11.94% undervalued |
-27.28% |
13.39 |
ValuEngine.com is an independent research provider, producing buy/hold/sell recommendations, target price, and valuations on over 7,000 US and Canadian equities every trading day.
