


ValuEngine Top-Five BUY/STRONG BUY Upgrades
For today's bulletin we used our website's advanced screening functions to search for UPGRADES to BUY or STRONG BUY with complete forecast and valuation data. They are presented by one-month forecast return. Titan Pharmaceuticals, Inc. (TTNP) is the leader here.
|
Ticker |
Company Name |
Market Price |
Valuation |
Last 12-M Return |
1-M Forecast Return |
1-Yr Forecast Return |
P/E Ratio |
Sector Name |
|
TTNP |
TITAN PHARMA |
5.44 |
-7.70% |
26.76% |
0.89% |
10.63% |
17.55 |
Medical |
|
SYBT |
STOCK YARDS BCP |
27.94 |
-36.31% |
10.29% |
0.87% |
10.43% |
16.53 |
Finance |
|
AKS |
AK STEEL HLDG |
4.85 |
-24.95% |
27.30% |
0.66% |
7.86% |
26.94 |
Basic Materials |
|
BLD |
TOPBUILD CORP |
35.99 |
11.10% |
33.30% |
0.58% |
6.99% |
20.33 |
Construction |
|
DEG |
DELHAIZE-LE |
26.48 |
6.38% |
26.04% |
0.56% |
6.74% |
20.61 |
Retail-Wholesale |
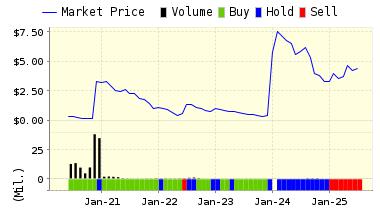
Below is today's data on Titan Pharmaceuticals, Inc. (TTNP):
Titan Pharmaceuticals, Inc. is a biopharmaceutical company developing proprietary therapeutics for the treatment of central nervous system disorders, cancer, and other serious and life threatening diseases. In the central nervous system arena, the company is developing iloperidone, which is clinical testing for schizophrenia through a licensing and development agreement with Novartis Pharma AG. Novartis has tradenamed the product Zomaril.
ValuEngine updated its recommendation from HOLD to BUY for TITAN PHARMA on 2016-07-01. Based on the information we have gathered and our resulting research, we feel that TITAN PHARMA has the probability to OUTPERFORM average market performance for the next year. The company exhibits ATTRACTIVE Momentum and P/E Ratio.
|
ValuEngine Forecast |
||
|
Target |
Expected |
|
|---|---|---|
|
1-Month |
5.49 | 0.89% |
|
3-Month |
5.52 | 1.40% |
|
6-Month |
5.56 | 2.14% |
|
1-Year |
6.02 | 10.63% |
|
2-Year |
5.52 | 1.53% |
|
3-Year |
5.35 | -1.62% |
|
Valuation & Rankings |
|||
|
Valuation |
7.70% undervalued |
Valuation Rank(?) |
|
|
1-M Forecast Return |
0.89% |
1-M Forecast Return Rank |
|
|
12-M Return |
26.76% |
Momentum Rank(?) |
|
|
Sharpe Ratio |
-0.15 |
Sharpe Ratio Rank(?) |
|
|
5-Y Avg Annual Return |
-12.09% |
5-Y Avg Annual Rtn Rank |
|
|
Volatility |
82.04% |
Volatility Rank(?) |
|
|
Expected EPS Growth |
-58.06% |
EPS Growth Rank(?) |
|
|
Market Cap (billions) |
0.60 |
Size Rank |
|
|
Trailing P/E Ratio |
17.55 |
Trailing P/E Rank(?) |
|
|
Forward P/E Ratio |
41.85 |
Forward P/E Ratio Rank |
|
|
PEG Ratio |
n/a |
PEG Ratio Rank |
|
|
Price/Sales |
787.37 |
Price/Sales Rank(?) |
|
|
Market/Book |
109.20 |
Market/Book Rank(?) |
|
|
Beta |
1.74 |
Beta Rank |
|
|
Alpha |
0.19 |
Alpha Rank |
|
ValuEngine Market Overview
|
Summary of VE Stock Universe |
|
|
Stocks Undervalued |
63.23% |
|
Stocks Overvalued |
36.77% |
|
Stocks Undervalued by 20% |
28.28% |
|
Stocks Overvalued by 20% |
12.33% |
ValuEngine Sector Overview
|
Sector |
Change |
MTD |
YTD |
Valuation |
Last 12-MReturn |
P/E Ratio |
|
-2.79% |
-1.70% |
36.35% |
7.60% overvalued |
29.41% |
28.97 |
|
|
-0.43% |
-0.21% |
10.30% |
5.25% overvalued |
10.18% |
23.12 |
|
|
-1.39% |
-1.03% |
6.97% |
5.04% overvalued |
5.45% |
23.86 |
|
|
-1.81% |
-1.44% |
2.70% |
0.80% undervalued |
-7.95% |
18.36 |
|
|
-1.46% |
-0.77% |
15.41% |
0.88% undervalued |
-25.53% |
23.41 |
|
|
-2.23% |
-1.50% |
3.33% |
3.49% undervalued |
-6.90% |
21.39 |
|
|
-1.67% |
-1.22% |
10.15% |
4.59% undervalued |
-10.37% |
22.80 |
|
|
-0.29% |
-0.15% |
-5.18% |
5.29% undervalued |
-1.86% |
19.35 |
|
|
-1.34% |
-0.99% |
4.32% |
6.49% undervalued |
-7.08% |
28.64 |
|
|
-1.39% |
-1.00% |
0.20% |
6.60% undervalued |
-4.07% |
15.89 |
|
|
-1.95% |
-1.31% |
20.33% |
6.94% undervalued |
0.02% |
20.70 |
|
|
-0.23% |
0.03% |
2.39% |
7.82% undervalued |
-9.34% |
21.27 |
|
|
-1.87% |
-1.21% |
-4.18% |
12.22% undervalued |
-13.61% |
21.60 |
|
|
0.33% |
0.56% |
-3.35% |
13.14% undervalued |
-22.61% |
27.37 |
|
|
-0.29% |
0.15% |
0.59% |
14.25% undervalued |
-26.59% |
13.50 |
|
|
0.62% |
0.94% |
-3.97% |
20.28% undervalued |
-15.83% |
11.54 |
ValuEngine.com is an independent research provider, producing buy/hold/sell recommendations, target price, and valuations on over 7,000 US and Canadian equities every trading day.
