


Ch-Ch-Ch-Changes
--Big Turnover For ValuEngine SP500 Top Stock List As HP Enterprise Takes Number One
We can use our data to track individual stocks, industries, sectors, and indices. For today's bulletin, we present key metrics for the top picks in the S&P 500. The companies listed below represent the top-ten BUY/STRONG BUY stocks within the index. They are presented below according to their one-month forecast target prices.
This week, we find a great deal of turnover since the last time we looked at the SP500 back in October. We have 80% turnover, with a new member and leader in Hewlett Packard Enterprise. The only stocks left from the last time we published our top-ten list are Applied Materials--which declined from second to fourth--and LAM Research--which maintained its position in seventh.
Other newcomers include Navient Corp, Urban Outfitters, TIme Warner, Scripps Networks, Exelon Corp, Qualcomm, and Best Buy. Those new companies have replaced Michael Kors, Tyson Foods, CBS, KLA Tencor, United Rentals, Broadcom, Zimmer Biomet, and International Paper.
While we have a tech-heavy list yet again, we also see that Retail and Consumer Discretionary firms are making a strong showing this month. In addition, the first four firms are ranked STRONG BUY while the remainder are BUY-rated this time around.
|
Ticker |
Company Name |
Market Price |
Valuation |
Last 12-M Retrn |
1-M Forecast Retn |
1-Yr Forecast Retn |
P/E Ratio |
Sector Name |
Oct. 20, 2016 |
|
HPE |
HEWLETT PKD ENT |
23.8 |
NA |
60.16% |
1.23% |
14.87% |
12.33 |
Computer and Technology |
KORS |
|
NAVI |
NAVIENT CORP |
17.23 |
26.40% |
44.67% |
1.19% |
14.27% |
9.18 |
Finance |
AMAT |
|
URBN |
URBAN OUTFITTER |
31.6 |
-11.66% |
41.07% |
1.14% |
13.67% |
16.46 |
Retail-Wholesale |
TSN |
|
AMAT |
APPLD MATLS INC |
32.2 |
1.20% |
71.55% |
1.11% |
13.38% |
18.30 |
Computer and Technology |
CBS |
|
TWX |
TIME WARNER INC |
91.82 |
-1.80% |
31.21% |
1.02% |
12.25% |
16.07 |
Consumer Discretionary |
KLAC |
|
SNI |
SCRIPPS NETWRKS |
69.26 |
-0.86% |
21.94% |
1.00% |
12.06% |
12.68 |
Consumer Discretionary |
URI |
|
LRCX |
LAM RESEARCH |
106.02 |
8.37% |
35.58% |
0.97% |
11.68% |
16.15 |
Computer and Technology |
LRCX |
|
EXC |
EXELON CORP |
32.51 |
-2.85% |
19.04% |
0.96% |
11.55% |
12.33 |
Utilities |
AVGO |
|
QCOM |
QUALCOMM INC |
68.13 |
7.18% |
39.64% |
0.96% |
11.50% |
17.02 |
Computer and Technology |
ZBH |
|
BBY |
BEST BUY |
45.7 |
50.74% |
43.80% |
0.89% |
10.67% |
14.46 |
Retail-Wholesale |
IP |
NOTE: New stocks are in BOLD
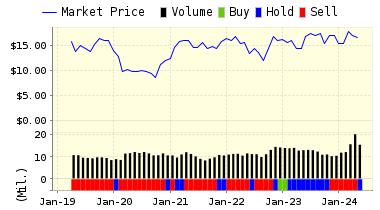
Below is today's data on one of our SP500 top-ten newcomers, Hewlett Packard Enterprise Company (HPE).
Hewlett Packard Enterprise Company was spun-off from the Hewlett-Packard Company in November 2015. The company operates in four segments: Enterprise Services, Enterprise Group, Software and Financial Services. The Enterprise Group is the company's largest revenue contributor, accounting for more than half of total revenues. This segment offers servers, management software, converged infrastructure solutions and technology services; hybrid cloud solutions, business critical systems and storage products. The Software segment offers software to capture, store, explore, analyze, protect and share information and insights within and outside organizations; enterprise security, application delivery management, IT operations management software products. The Enterprise Services segment offers consulting, outsourcing and support services across infrastructure, applications and business process domains; application and business services. The company is headquartered in Palo Alto, California.
ValuEngine continues its STRONG BUY recommendation on Hewlett Packard Enterprise for 2016-11-30. Based on the information we have gathered and our resulting research, we feel that Hewlett Packard Enterprise has the probability to OUTPERFORM average market performance for the next year. The company exhibits ATTRACTIVE Company Size and Sharpe Ratio.
You can download a free copy of detailed report on Hewlett Packard Enterprise (HPE) from the link below.
|
ValuEngine Forecast |
||
|
Target |
Expected |
|
|---|---|---|
|
1-Month |
102.19 | 0.32% |
|
3-Month |
101.74 | -0.12% |
|
6-Month |
100.51 | -1.33% |
|
1-Year |
105.78 | 3.84% |
|
2-Year |
95.06 | -6.68% |
|
3-Year |
72.29 | -29.03% |
|
Valuation & Rankings |
|||
|
Valuation |
18.08% undervalued |
Valuation Rank(?) |
|
|
1-M Forecast Return |
0.32% |
1-M Forecast Return Rank |
|
|
12-M Return |
0.84% |
Momentum Rank(?) |
|
|
Sharpe Ratio |
0.67 |
Sharpe Ratio Rank(?) |
|
|
5-Y Avg Annual Return |
13.89% |
5-Y Avg Annual Rtn Rank |
|
|
Volatility |
20.70% |
Volatility Rank(?) |
|
|
Expected EPS Growth |
7.76% |
EPS Growth Rank(?) |
|
|
Market Cap (billions) |
17.25 |
Size Rank |
|
|
Trailing P/E Ratio |
12.88 |
Trailing P/E Rank(?) |
|
|
Forward P/E Ratio |
11.96 |
Forward P/E Ratio Rank |
|
|
PEG Ratio |
1.66 |
PEG Ratio Rank |
|
|
Price/Sales |
2.27 |
Price/Sales Rank(?) |
|
|
Market/Book |
1.77 |
Market/Book Rank(?) |
|
|
Beta |
1.26 |
Beta Rank |
|
|
Alpha |
-0.02 |
Alpha Rank |
|

DOWNLOAD A FREE SAMPLE OF OUR HEWLETT PACKARD ENTERPRISE (HPE) REPORT BY CLICKING HERE
ValuEngine Market Overview
|
Summary of VE Stock Universe |
|
|
Stocks Undervalued |
36.75% |
|
Stocks Overvalued |
63.25% |
|
Stocks Undervalued by 20% |
16.26% |
|
Stocks Overvalued by 20% |
31.98% |
ValuEngine Sector Overview
|
Sector |
Change |
MTD |
YTD |
Valuation |
Last 12-MReturn |
P/E Ratio |
|
-0.32% |
8.22% |
24.34% |
22.26% overvalued |
14.43% |
23.89 |
|
|
-0.29% |
3.82% |
10.41% |
21.23% overvalued |
4.15% |
19.41 |
|
|
0.76% |
9.07% |
13.37% |
19.78% overvalued |
10.58% |
19.71 |
|
|
-1.53% |
0.56% |
18.16% |
17.29% overvalued |
7.35% |
25.91 |
|
|
0.18% |
7.26% |
32.86% |
13.54% overvalued |
13.11% |
21.14 |
|
|
-0.20% |
9.20% |
17.19% |
13.32% overvalued |
1.77% |
18.14 |
|
|
0.11% |
7.18% |
13.66% |
12.52% overvalued |
7.56% |
17.04 |
|
|
-0.17% |
5.21% |
21.18% |
11.93% overvalued |
5.95% |
30.01 |
|
|
-0.72% |
5.44% |
53.81% |
11.42% overvalued |
61.30% |
28.03 |
|
|
-0.07% |
7.70% |
20.37% |
9.75% overvalued |
0.66% |
24.43 |
|
|
-0.09% |
4.79% |
10.54% |
6.47% overvalued |
6.72% |
23.88 |
|
|
-0.35% |
2.33% |
14.40% |
6.10% overvalued |
12.77% |
21.75 |
|
|
-0.14% |
5.93% |
2.71% |
5.52% overvalued |
2.45% |
23.16 |
|
|
-0.56% |
4.66% |
10.08% |
3.48% overvalued |
12.60% |
14.66 |
|
|
0.22% |
1.21% |
8.52% |
2.51% overvalued |
3.92% |
23.98 |
|
|
-0.01% |
2.76% |
0.07% |
2.55% undervalued |
-13.27% |
26.38 |
