


Since we last reported on the NASDAQ back in November, we find a 40% turnover. However, three of the top four companies have held onto their positions. Applied Materials has retained its lead yet again, with LAM Research and Netease keeping their second and fourth spots respectively.
CA Inc, Cisco Systems, and Broadcom have declined to make room for newcomers Qualcomm, Paccar, Seagate Technology, and American Airlines. Dollar Tree, Nvidia, NXP Semiconductor, and ULTA Cosmetics have fallen out of our top-ten this month.
Note too, all of these companies are BUY-rated with the exception of leader Applied Materials. That company remains a STRNG BUY.
|
Ticker |
Company Name |
Market Price |
Valuation |
Last 12-M Retrn |
1-M Forecast Retn |
1-Yr Forecast Retn |
P/E Ratio |
Sector |
11-3-2016 Leaders |
|
AMAT |
APPLD MATLS INC |
32.51 |
5.48% |
71.92% |
1.04% |
12.52% |
17.17 |
Computer and Technology |
AMAT |
|
LRCX |
LAM RESEARCH |
106.55 |
7.00% |
36.80% |
0.92% |
11.04% |
15.73 |
Computer and Technology |
LRCX |
|
QCOM |
QUALCOMM INC |
68.34 |
7.22% |
30.35% |
0.78% |
9.32% |
16.80 |
Computer and Technology |
AVGO |
|
NTES |
NETEASE INC |
223.16 |
-0.22% |
25.41% |
0.70% |
8.44% |
17.72 |
Computer and Technology |
NTES |
|
PCAR |
PACCAR INC |
67.63 |
36.99% |
37.96% |
0.68% |
8.10% |
17.18 |
Auto-Tires-Trucks |
CA |
|
STX |
SEAGATE TECH |
40.27 |
10.71% |
14.73% |
0.64% |
7.72% |
14.02 |
Computer and Technology |
CSCO |
|
AAL |
AMER AIRLINES |
48.65 |
26.70% |
6.27% |
0.63% |
7.58% |
7.02 |
Transportation |
DLTR |
|
CA |
CA INC |
31.75 |
12.51% |
11.64% |
0.57% |
6.87% |
13.47 |
Computer and Technology |
NVDA |
|
CSCO |
CISCO SYSTEMS |
29.95 |
2.95% |
8.95% |
0.52% |
6.26% |
13.93 |
Computer and Technology |
NXPI |
|
AVGO |
BROADCOM LTD |
168.55 |
-0.53% |
13.25% |
0.49% |
5.85% |
17.09 |
Computer and Technology |
ULTA |
NOTE: New stocks are in BOLD
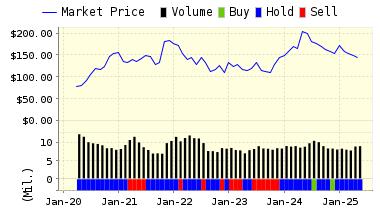
Below is today's data on Qualcomm (QCOM):
QUALCOMM Inc. develops and delivers innovative digital wireless communications products and services based on the company's CDMA digital technology. The company's business areas include CDMA integrated circuits and system software; technology licensing; the Binary Runtime Environment for Wireless applications development platform; Eudora e-mail software; digital cinema systems; and satellite-based systems including portions of the Globalstar system and wireless fleet management systems, OmniTRACS and OmniExpress.
VALUENGINE RECOMMENDATION: ValuEngine continues its BUY recommendation on Qualcomm for 2016-12-07. Based on the information we have gathered and our resulting research, we feel that Qualcomm has the probability to OUTPERFORM average market performance for the next year. The company exhibits ATTRACTIVE Company Size and Momentum.
You can download a free copy of detailed report on Qualcomm (QCOM) from the link below.
|
ValuEngine Forecast |
||
|
Target |
Expected |
|
|---|---|---|
|
1-Month |
68.87 | 0.78% |
|
3-Month |
69.26 | 1.35% |
|
6-Month |
70.02 | 2.46% |
|
1-Year |
74.71 | 9.32% |
|
2-Year |
69.70 | 1.99% |
|
3-Year |
72.53 | 6.13% |
|
Valuation & Rankings |
|||
|
Valuation |
7.22% overvalued |
Valuation Rank(?) |
|
|
1-M Forecast Return |
0.78% |
1-M Forecast Return Rank |
|
|
12-M Return |
30.35% |
Momentum Rank(?) |
|
|
Sharpe Ratio |
0.18 |
Sharpe Ratio Rank(?) |
|
|
5-Y Avg Annual Return |
4.35% |
5-Y Avg Annual Rtn Rank |
|
|
Volatility |
24.20% |
Volatility Rank(?) |
|
|
Expected EPS Growth |
-0.08% |
EPS Growth Rank(?) |
|
|
Market Cap (billions) |
112.89 |
Size Rank |
|
|
Trailing P/E Ratio |
16.80 |
Trailing P/E Rank(?) |
|
|
Forward P/E Ratio |
16.82 |
Forward P/E Ratio Rank |
|
|
PEG Ratio |
n/a |
PEG Ratio Rank |
|
|
Price/Sales |
4.79 |
Price/Sales Rank(?) |
|
|
Market/Book |
5.00 |
Market/Book Rank(?) |
|
|
Beta |
1.40 |
Beta Rank |
|
|
Alpha |
0.26 |
Alpha Rank |
|

DOWNLOAD A FREE SAMPLE OF OUR DOLLAR TREE (DLTR) REPORT BY CLICKING HERE
ValuEngine Market Overview
|
Summary of VE Stock Universe |
|
|
Stocks Undervalued |
34.82% |
|
Stocks Overvalued |
65.18% |
|
Stocks Undervalued by 20% |
15.9% |
|
Stocks Overvalued by 20% |
32.91% |
ValuEngine Sector Overview
|
Sector |
Change |
MTD |
YTD |
Valuation |
Last 12-MReturn |
P/E Ratio |
|
0.87% |
2.84% |
28.12% |
25.57% overvalued |
21.82% |
24.01 |
|
|
1.09% |
3.22% |
14.07% |
21.01% overvalued |
9.75% |
19.45 |
|
|
0.58% |
1.48% |
14.80% |
19.33% overvalued |
12.40% |
20.44 |
|
|
1.09% |
3.73% |
60.40% |
16.77% overvalued |
65.60% |
27.85 |
|
|
0.04% |
2.73% |
31.03% |
16.56% overvalued |
22.19% |
25.30 |
|
|
1.50% |
3.30% |
38.58% |
15.39% overvalued |
19.64% |
20.77 |
|
|
0.78% |
2.51% |
16.31% |
14.87% overvalued |
10.75% |
18.15 |
|
|
1.18% |
3.16% |
21.43% |
14.35% overvalued |
8.30% |
18.77 |
|
|
0.98% |
1.96% |
20.49% |
11.18% overvalued |
5.28% |
23.87 |
|
|
0.43% |
1.12% |
21.40% |
10.86% overvalued |
9.53% |
29.98 |
|
|
0.92% |
2.16% |
4.74% |
9.38% overvalued |
5.57% |
23.92 |
|
|
1.90% |
3.70% |
14.69% |
9.25% overvalued |
19.79% |
15.01 |
|
|
0.97% |
1.79% |
12.10% |
8.37% overvalued |
10.65% |
23.75 |
|
|
1.09% |
1.67% |
15.00% |
6.70% overvalued |
17.06% |
22.14 |
|
|
0.68% |
1.15% |
8.65% |
3.06% overvalued |
5.49% |
24.14 |
|
|
-0.49% |
-0.13% |
-1.28% |
5.49% undervalued |
-8.42% |
27.37 |
