Hello fellow traders. In this technical blog we’re going to take a quick look at the past Elliott Wave chart of SPX published in members area of www.elliottwave-forecast.com. In further text we’re going to explain the Elliott Wave count nad trading strategy.
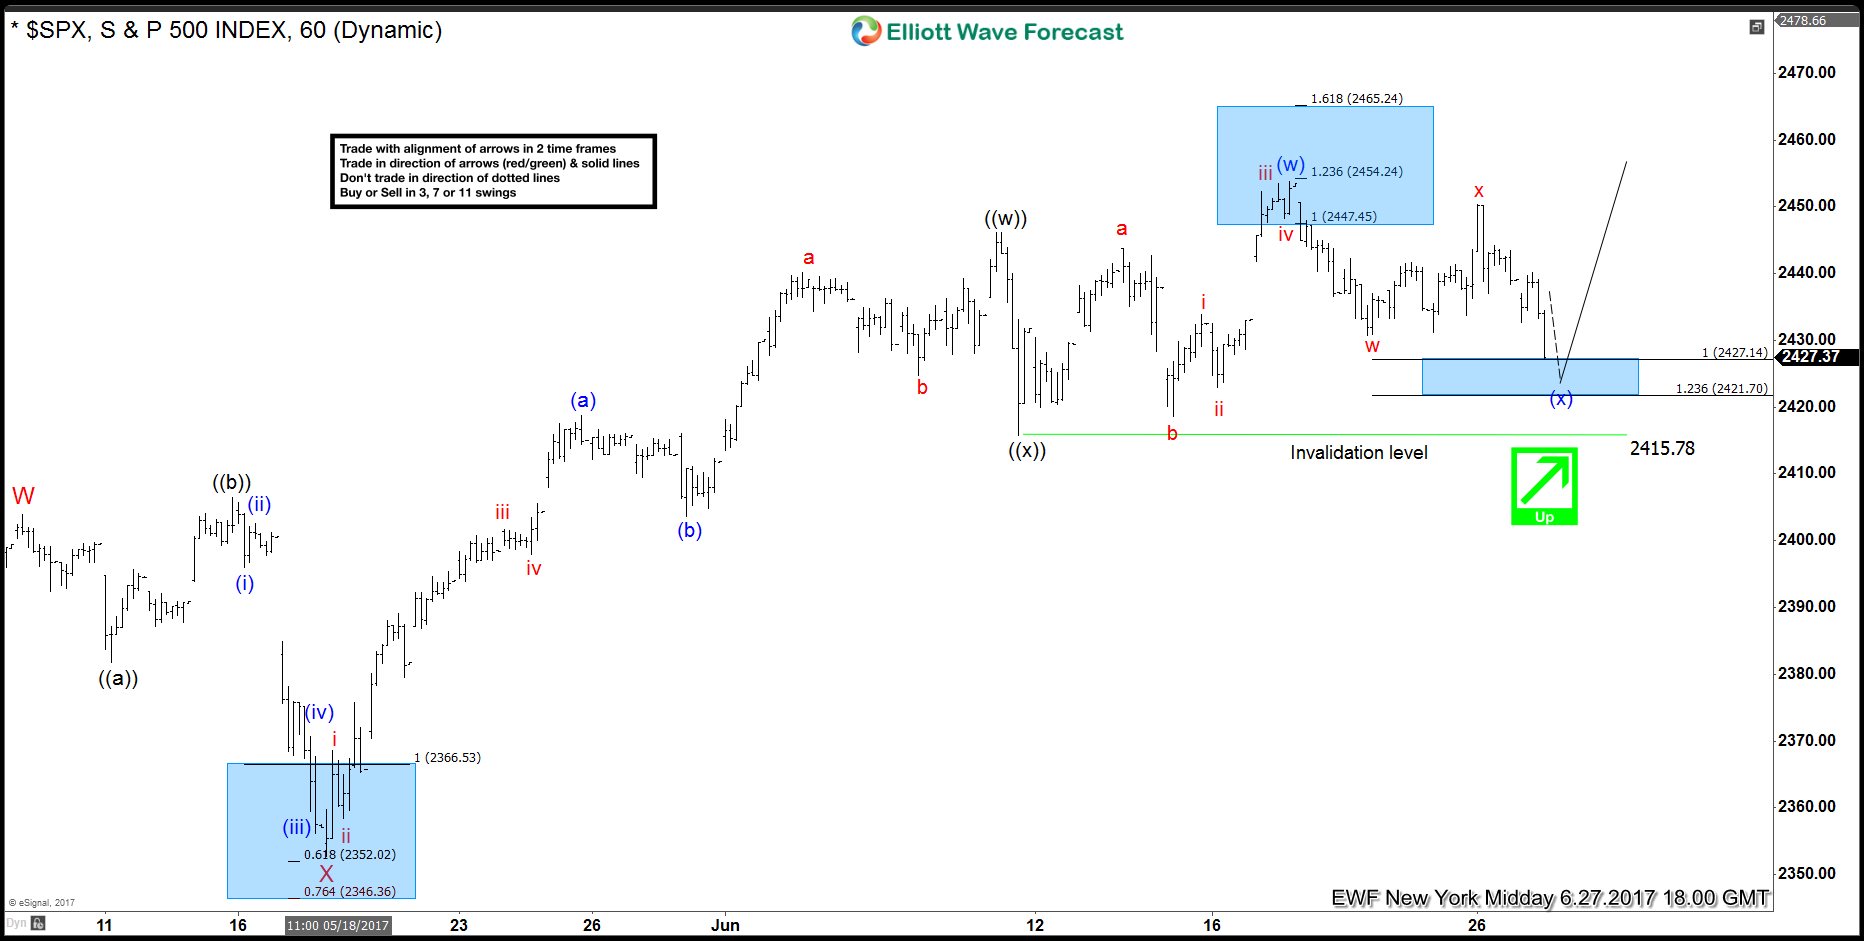
SPX Elliott Wave 1 Hour Chart 06.27.2017
As our members know, we were pointing out that SPX is supported due to its bulish sequences in Daily time frame. Back then, the index was showing incomplete bullish swings structure in the cycle from the 2083.4 ( November’s 2016 low). Consequently, we recommended members to avoid selling it and keep buying the dips in 3,7,11 swings. On the chart below we can see the index is bullish against the 2415.78 pivot in first degree. We expect it to ideally complete 3 waves from the peak soon. Short term technical area: 2427.14-2421.7 should ideally see buyers for 3 wave bounce. We recommend members to buy it at these levels against the 2415.7 invalidation level , and to make position risk free as soon bounce happen.
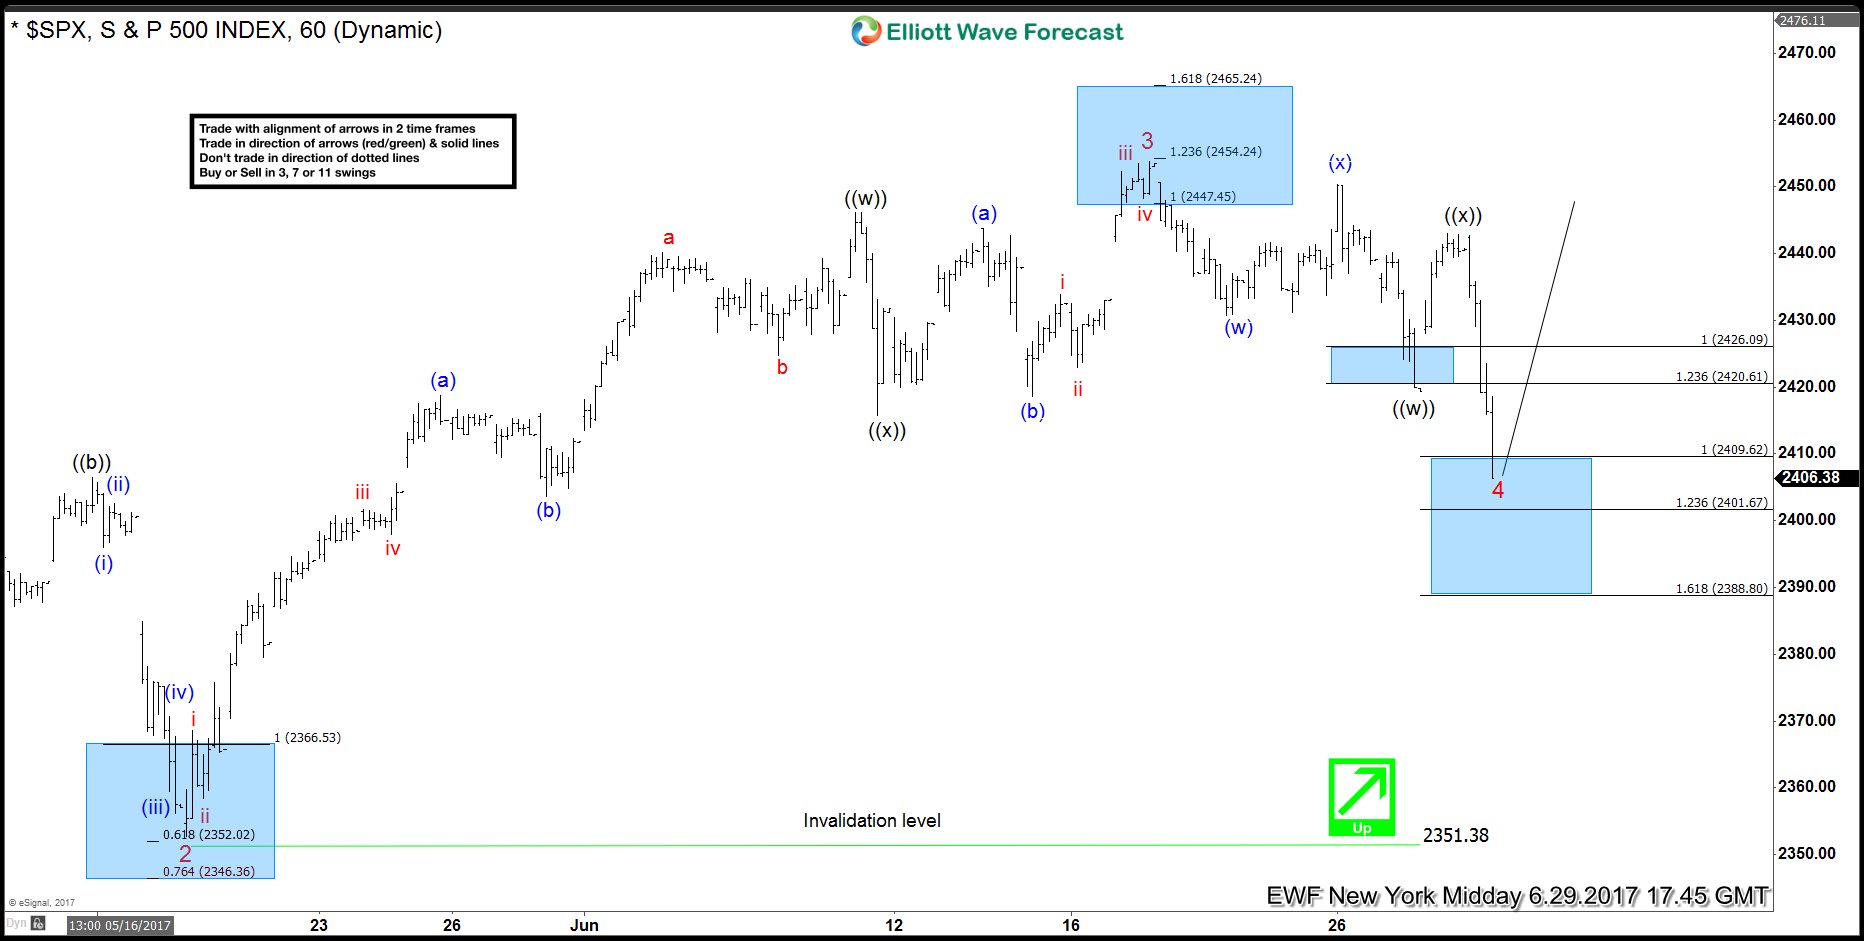
SPX Elliott Wave 1 Hour Chart 06.29.2017
The index found buyers as expected. SPX bounced from there and made long positions risk free. In mean time sellers were strong and the index made the new short term low. We measured next set of equal legs area from the peak and we got 2409.6-2401.6 as new buying zone. As we were out of the prevous trade without loss, we opened new long positions at mentioned area.
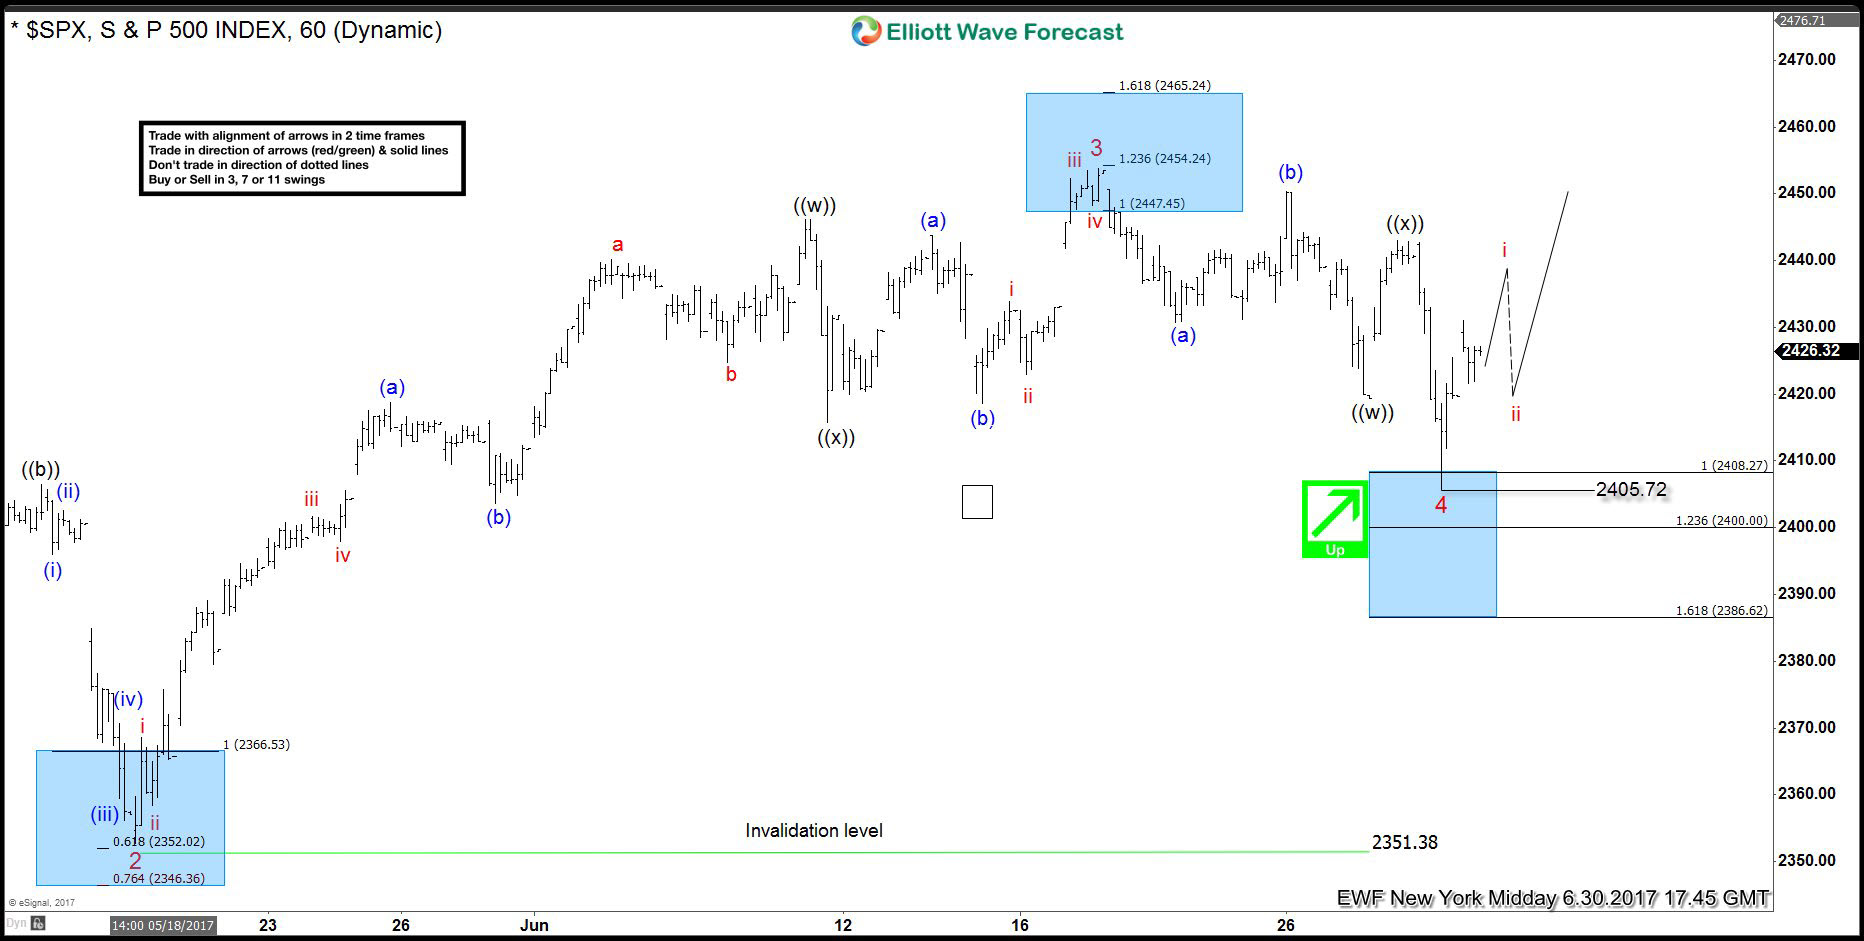
SPX Elliott Wave 1 Hour Chart 06.30.2017
We got nice reaction from buying zone and made long positions risk free. While the price stays above 2405.72 we’re calling wave 4 red pull back completed there and keep open long positions, expecting further rally toward new highs.
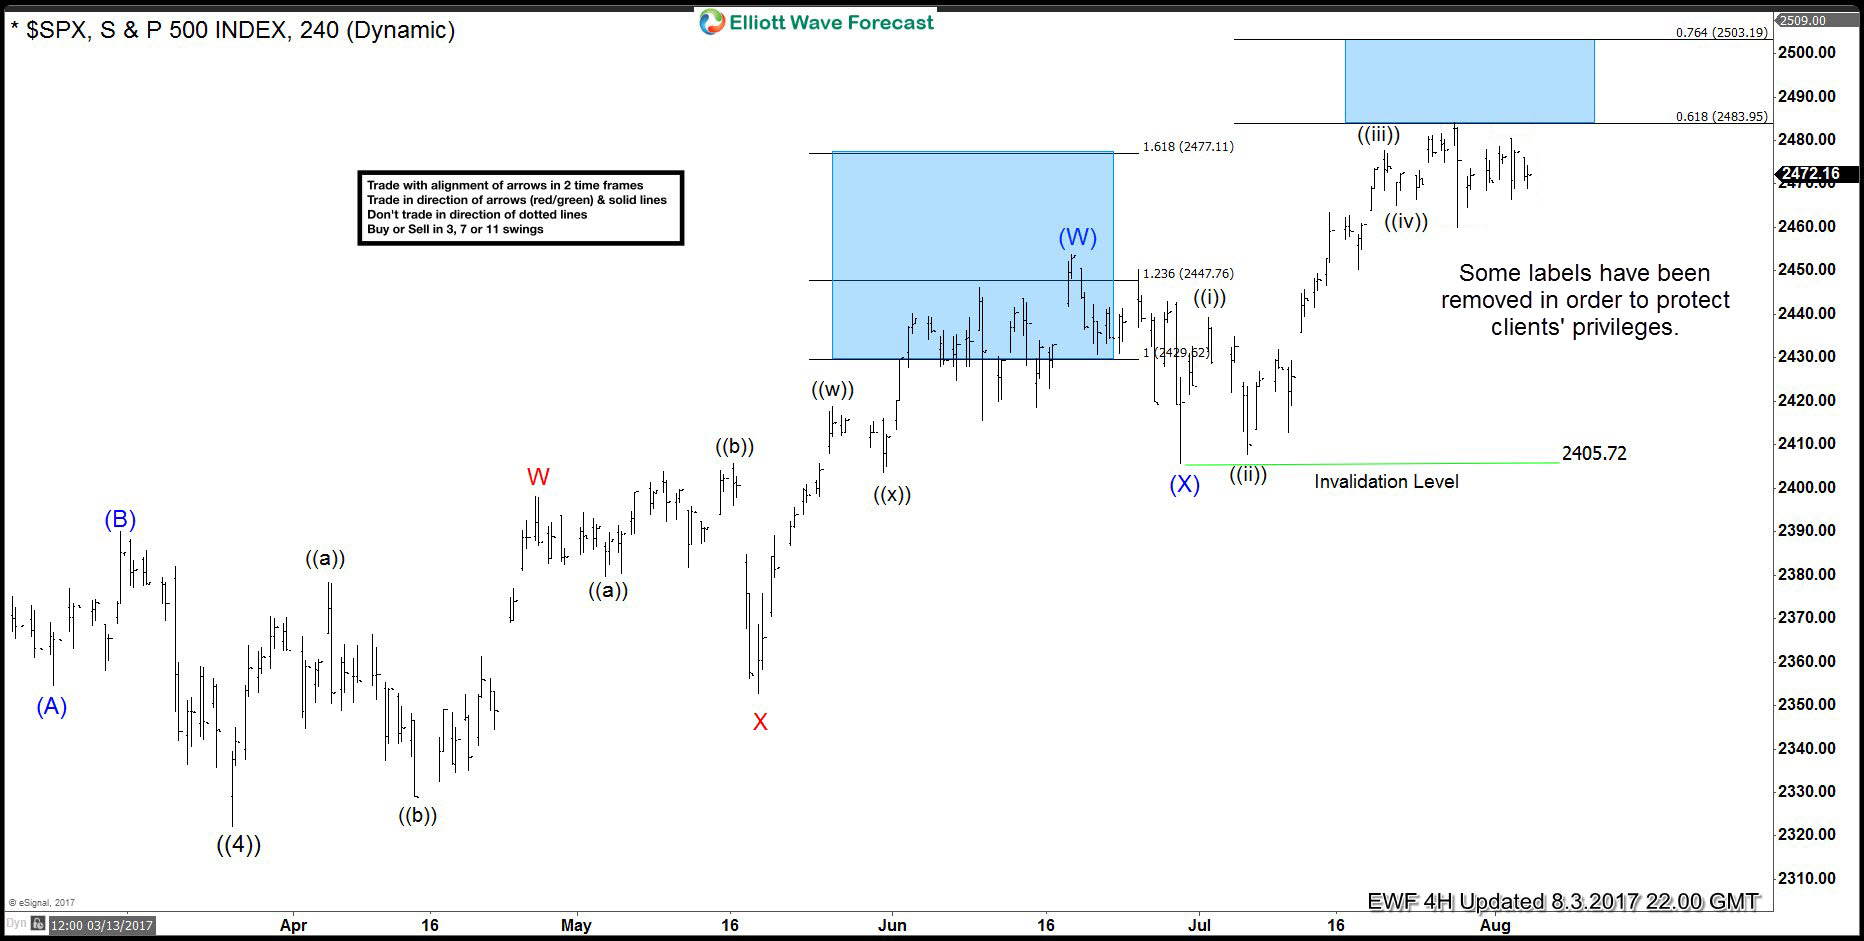
SPX Elliott Wave 4 Hour Chart 08.03.2017
In the mean time the index retested 2405.72 low and held it. We got nice rally toward new highs. The price has reached important technical area at 2483.95-2503.19 where buyers will be taking profits. Keep in mind market is very dynamic. If you’re interested new forecasts of SPX you can find them in the membership area of EWF.
Elliott Wave Forecast
We cover 78 instruments in total. If not a member yet, Sign Up for Free Trial now and get access to new trading opportunities.
Through time we have developed a very respectable trading strategy which defines Entry, Stop Loss and Take Profit levels with high accuracy and allows you to make position Risk Free, shortly after taking it. If you want to learn all about it and become a professional Trader, join us now for Free.