Hello fellow traders. In this technical blog we’re going to take a quick look at the past Elliott Wave charts of Nikkei published in members area of www.elliottwave-forecast.com. We’re going to explain the structure and see how we forecasted the path.
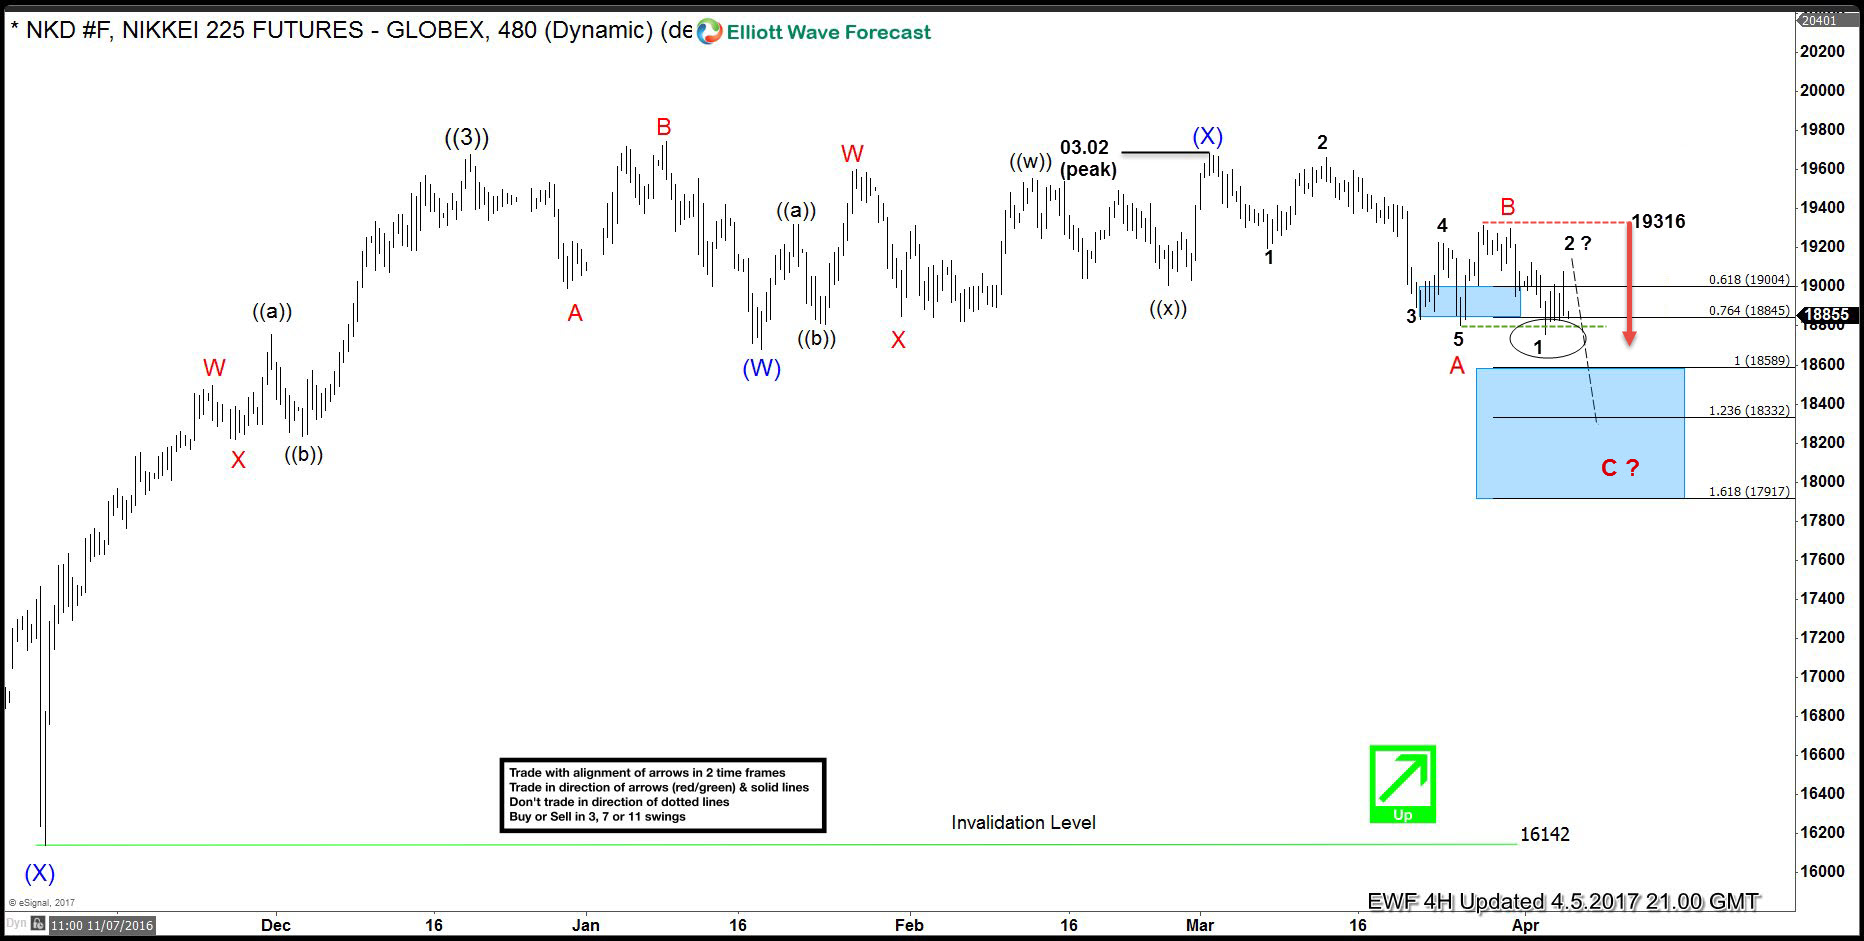
Let’s start by taking a look at Nikkei 4 hour chart from 04.05.217. As we can see on the chart below, first leg from the 03/02 peak has ended as 5 waves structure. It’s labeld as A red. On the 04/04 date we got break below A red and new short term low suggested that it’s not part of the same cycle anymore. Because of that , we labelled wave B red is done at 19316 high and as far as the price stays below that level, we should be in wave C red targeting 18589-17917 area. As the first leg has 5 waves structure, leg C red should be also in 5 waves.
Now let’s take a look at the short term structure.
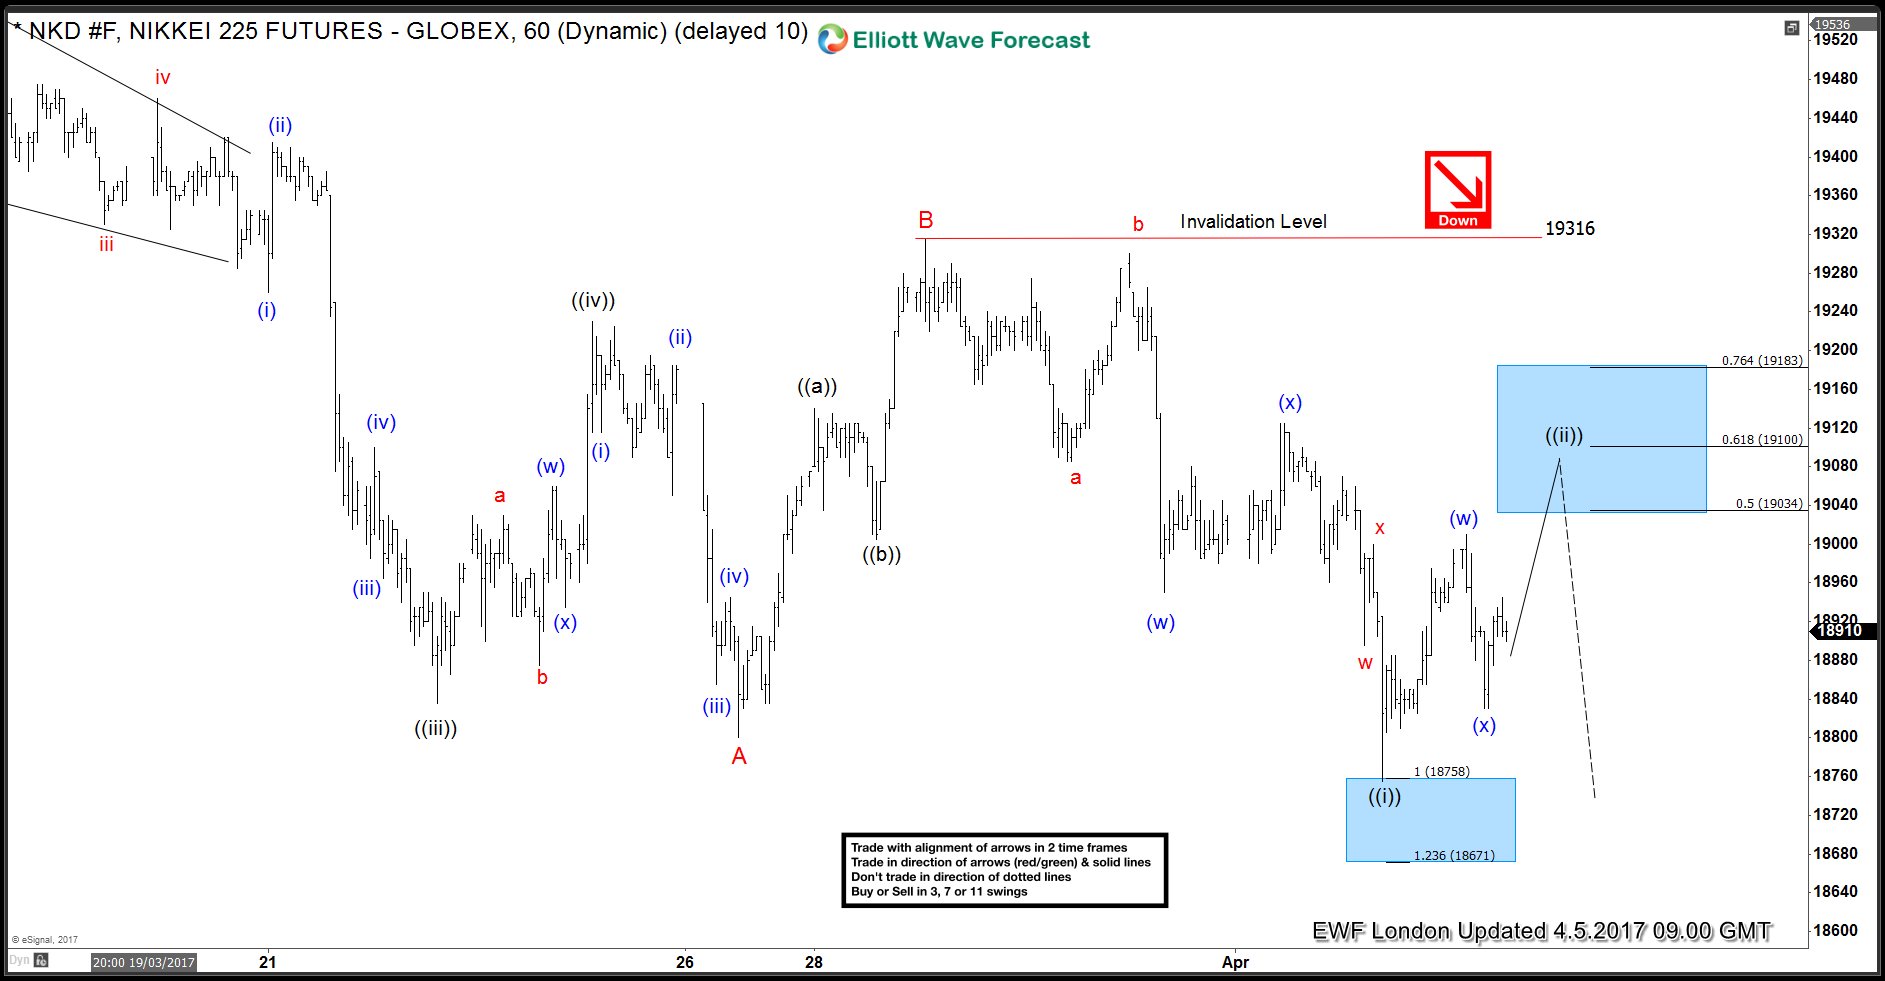
Nikkei Elliott Wave 1 Hour Chart 04/05 2017
Nikkei is bearish against the 19316 peak. Current view suggests the index is doing wave ((ii)) recovery which is unfolding as double three elliott wave structure. We expect it to make another leg up in wave (y) of ((ii)) toward 19034-19100 area. At that zone sellers will be waiting for furhter decline toward proposed taget area: 18589-17917
Eventually, the price has reached proposed blue box at 19034-19100, complete short term recovery, make decline toward new lows and reached the target at 18589-17917 . However there’s no any sign yet that cycle from the 03/02 peak is done yet. Keep in mind that market is very dynamic. If you’re interested in new Elliott Wave analysis of Nikkei you can find them in the membership area of EWF. We cover 52 instruments in total. If not a member yet, Sign Up for Free Trial now and get new trading opportunities.
Elliott Wave Forecast
Through time we have developed a very respectable trading strategy which defines Entry, Stop Loss and Take Profit levels with high accuracy and allows you to make position Risk Free, shortly after taking it. If you want to learn all about it and become a professional Trader, join us now for Free.


