


In this Technical blog, we are going to take a quick look at the past Elliott Wave Chart performance of NZDJPY. Which we presented to our clients at elliottwave-forecast.com. We are going to explain the structure and the forecast. As our members know, we were pointing out that the sequence from July 27.2017 peak is incomplete to the downside. Therefore, we advised our members to avoid buying into proposed bounces and should rather look for selling opportunity based on the incomplete bearish sequence to the downside from July 2017 peak. So let’s take a quick look at the past 1-hour performance of our charts below.
NZDJPY 12 March 2018 1 Hour Elliott Wave Chart
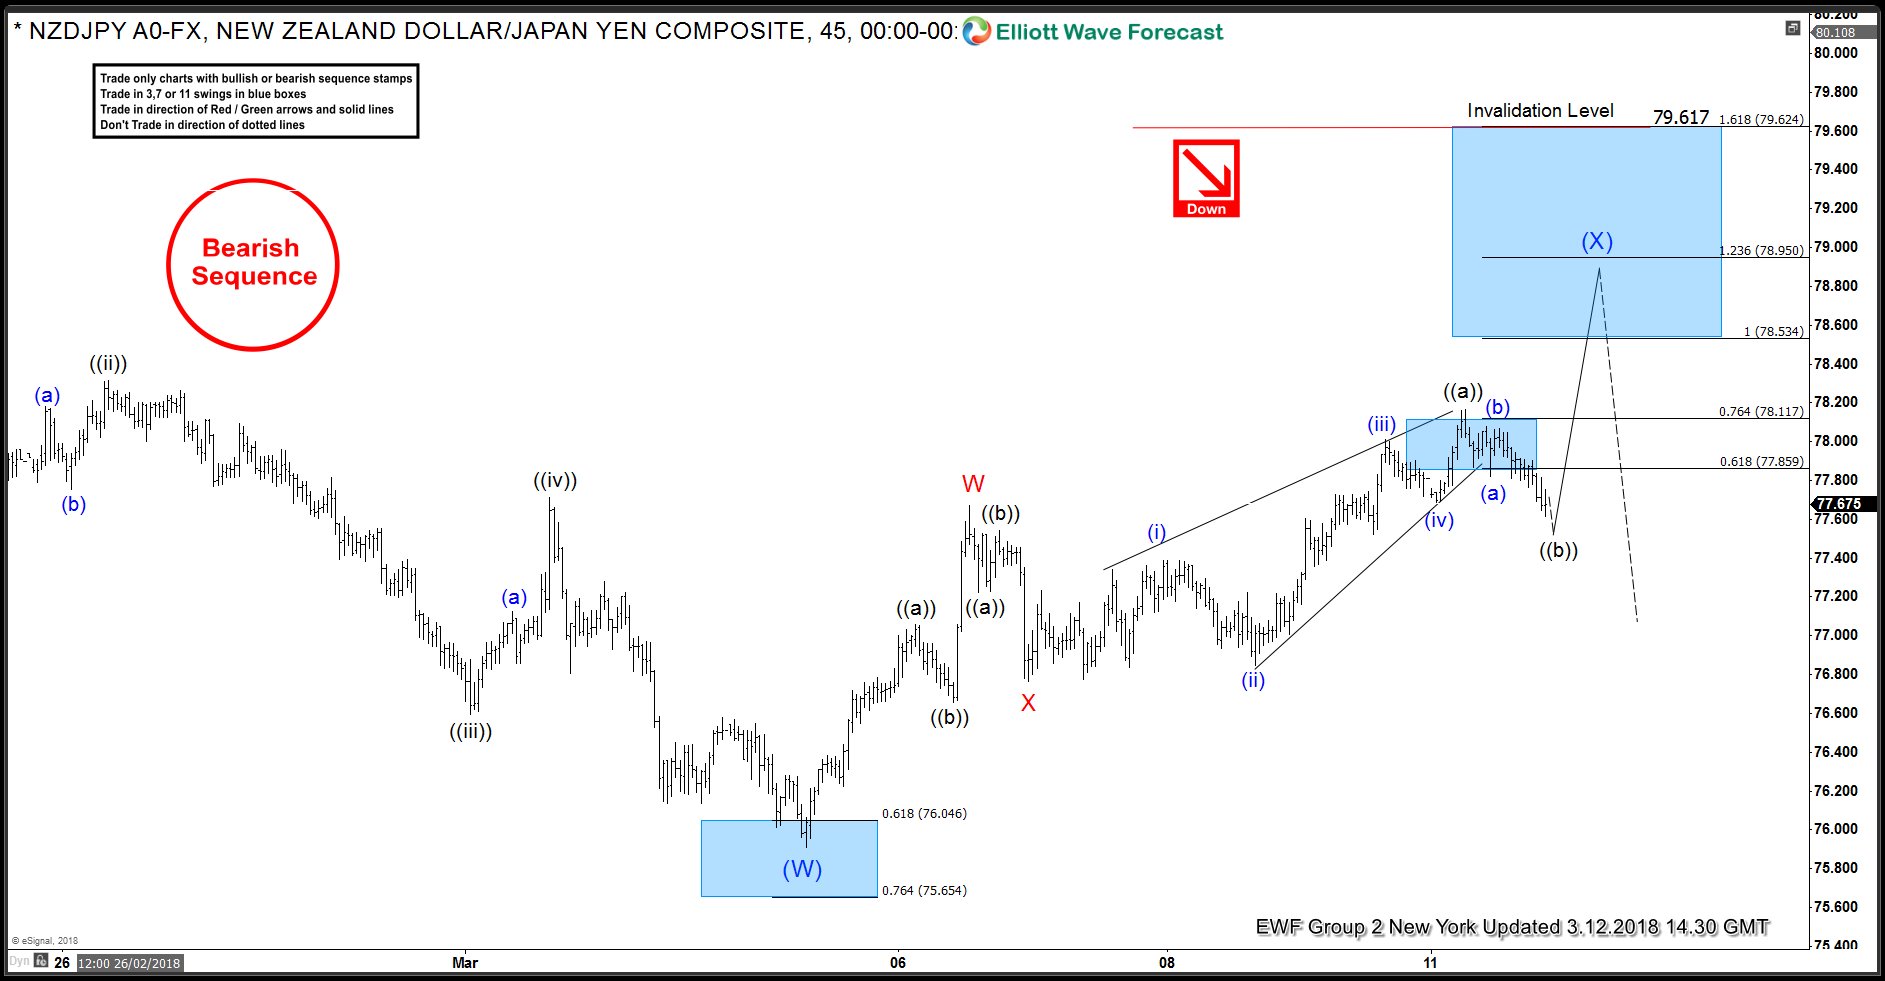
Above is the 1-hour Chart from March 12.2018 from New York update, in which the pair is showing a recovery in Intermediate wave (X) bounce as Elliott Wave Double Three structure. And that moment in time, the pair was having a 5 swing incomplete corrective sequence from 75.91 blue wave (W) low. Which thus supported the double three structure for another push higher to (78.53-78.95) 100%-123.6% Fibonacci extension area of red W-X to complete the 7 swing structure from blue (W) low (75.91) as far as it traded above 76.77 red wave X low before it resumes the decline.
NZDJPY 13 March 2018 1 Hour Elliott Wave Chart
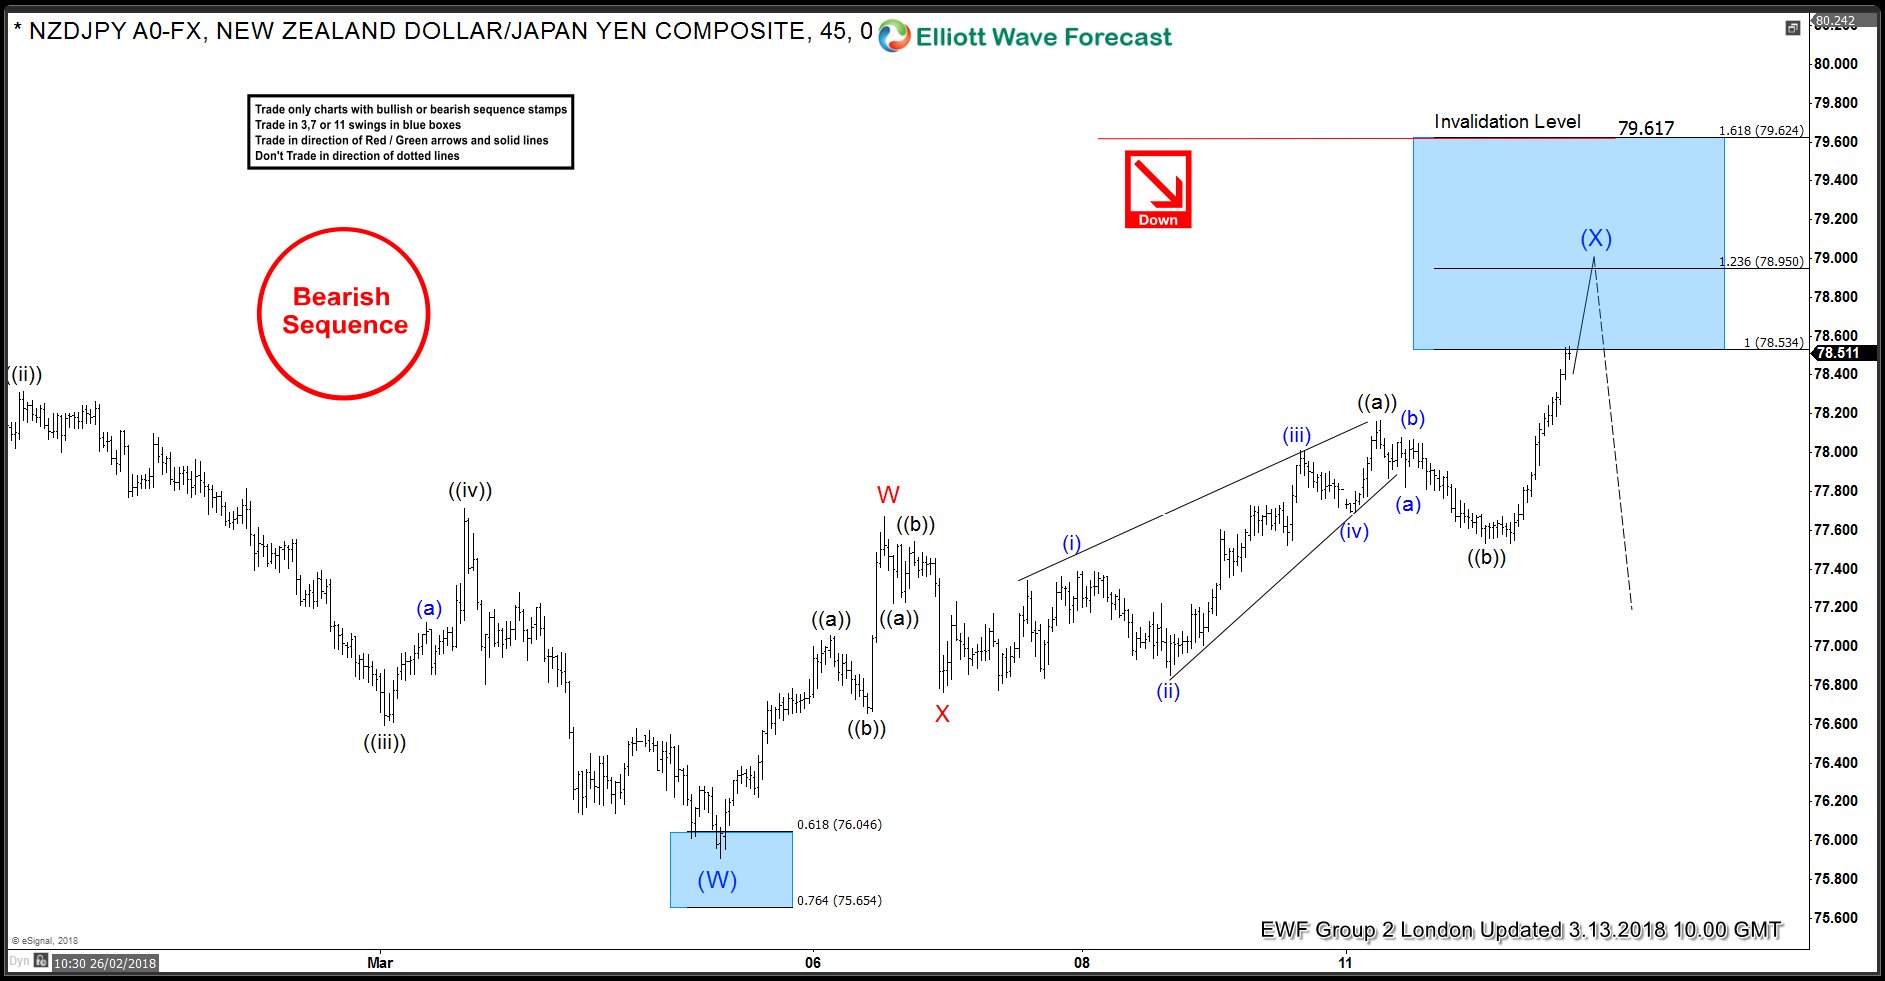
While above 76.77 red wave X low the pair then made a push higher as expected to our blue box area (potential seeling zone) at 78.53-78.95 to end the 7 swing structure from blue (W) low (75.91). Thus offered our client’s a good selling opportunity for 3 wave reaction lower at least as the right side of the market was selling the bounces. Also, it’s important to note that the 1-hour Chart above is showing bearish sequence tag, which represents the bearish trend to the downside.
NZDJPY 19 March 2018 1 Hour Elliott Wave Chart from London update
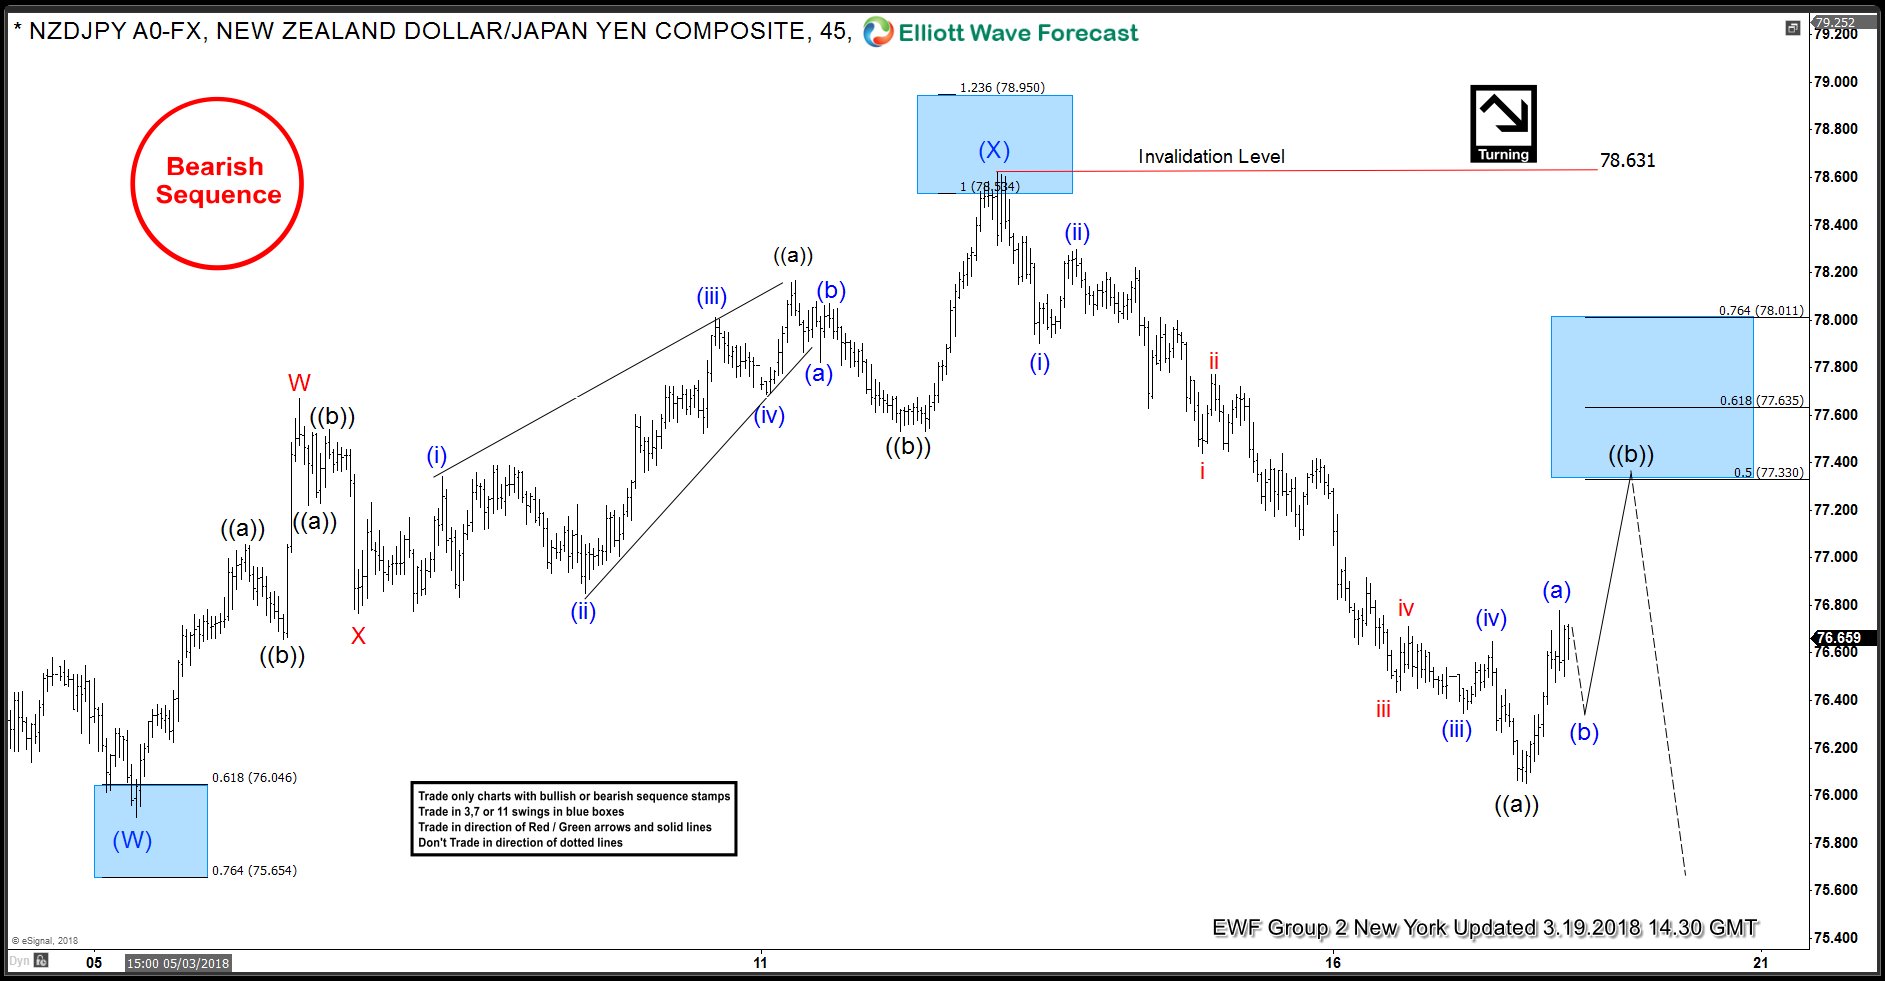
Here’s the 1-hour latest Chart from 19 March London update, showing the reaction lower in the pair after reaching our blue box area at 78.53-78.95. The pair then formed the peak in intermediate wave (X) bounce at 78.63 and made a nice decline lower for almost 200+ pips in profit so far. Thus allowed our members to create a risk-free position in the trade (where we advised member’s to lock the profit by putting the stop loss on entry level).
Currently, as far as bounces fail below 78.63 level pair is expected to see more downside to reach our target at 73.73-71.89 area. However, pair still needs to see a break below 85.91 intermediate wave (W) low to confirm the next extension lower in the pair and until than double correction in intermediate wave (X) bounce can’t be ruled out yet. Which if it happens then we would like to be seller’s again at the next set of equal legs area.
