


Since June peak at $3000, Bitcoin lost 35% of it’s value driving the rest of the cryptocurrency market into chaos as 1st August is approaching which is scheduled to trigger activation of Segregated Witness (SegWit) and could lead to a split in Bitcoin’s blockchain. There is no need to explain what’s going to happen in the coming weeks as the internet is already full of articles containing the details about it.
What’s really important is the price structure and how we can interpret it to get an idea about the possible coming path. We believe that the world market is ruled by technical analysis as fundamentals is only used to trigger the move. So as we have an important coming event for Bitcoin, then usually the market will send us a message through the charts which we can read it with different methods.
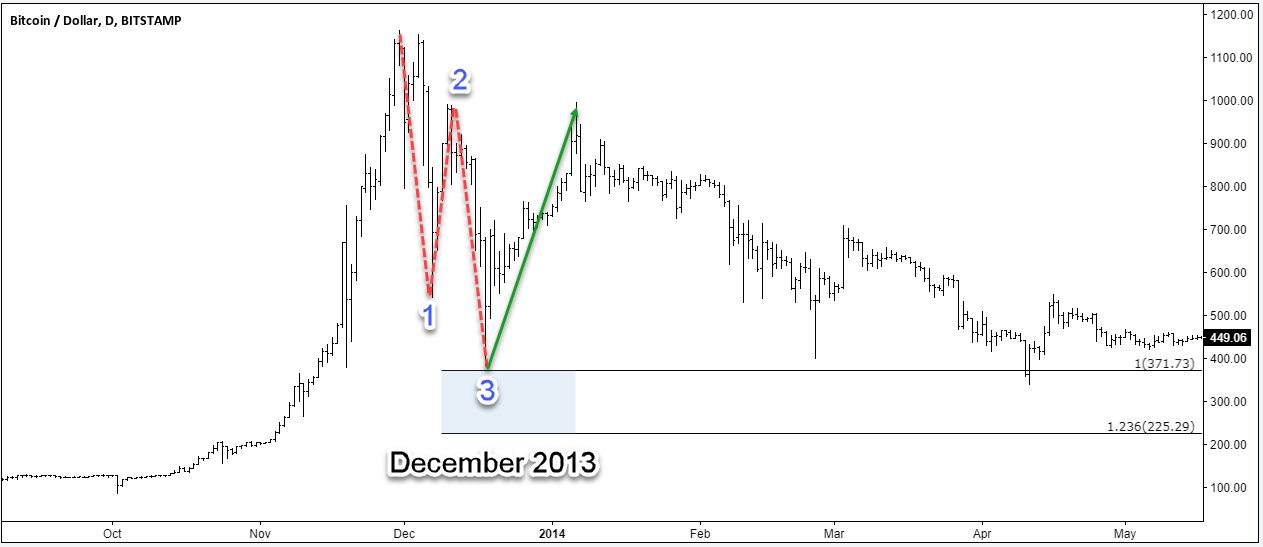
Let’s start by taking a look at previous BTCUSD chart and understand what the price has done in the past :
Bitcoin December 2013
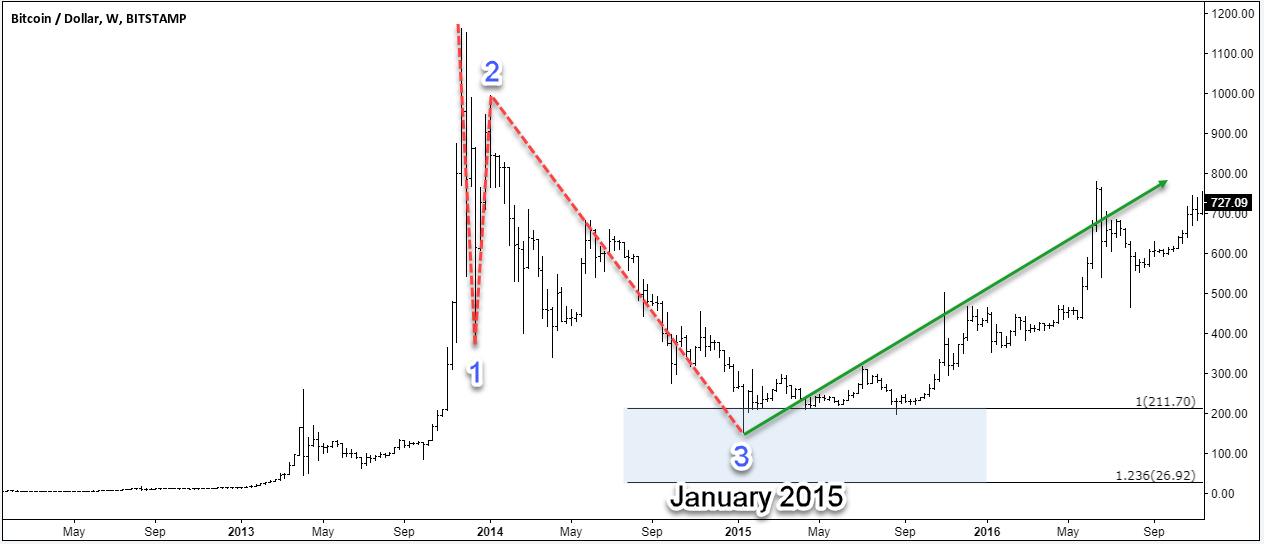
Bitcoin January 2015
Bitcoin July 2016

Bitcoin seems to be doing a simple 3 waves correction then bouncing higher again, so if you actually bought last year dip or even better the 2015 dip then you should be still enjoying the show from a lower price despite the recent drop. Every instrument around the world is doing the same thing over and over again : after a strong move in a bullish / bearish trend, the price starts a boring correction full of misleading movement to consume time until the next leg starts.
Bitcoin is no different from the others and it’s been following the same path in bigger & lower time frames. So why it didn’t rally to new highs after the first 3 waves pullback in June ?
We mentioned in our previous article how bitcoin can rally to new highs after ending a 3 swings pullback but if the pivot at June lows fails then it will end up extending the correction in 7 swings to the downside. The tricky part is to identify what type of correction is taking place because no one can predict how big the correction will be and how much time will it take.
Bitcoin WXY 8H Chart 07/16/2017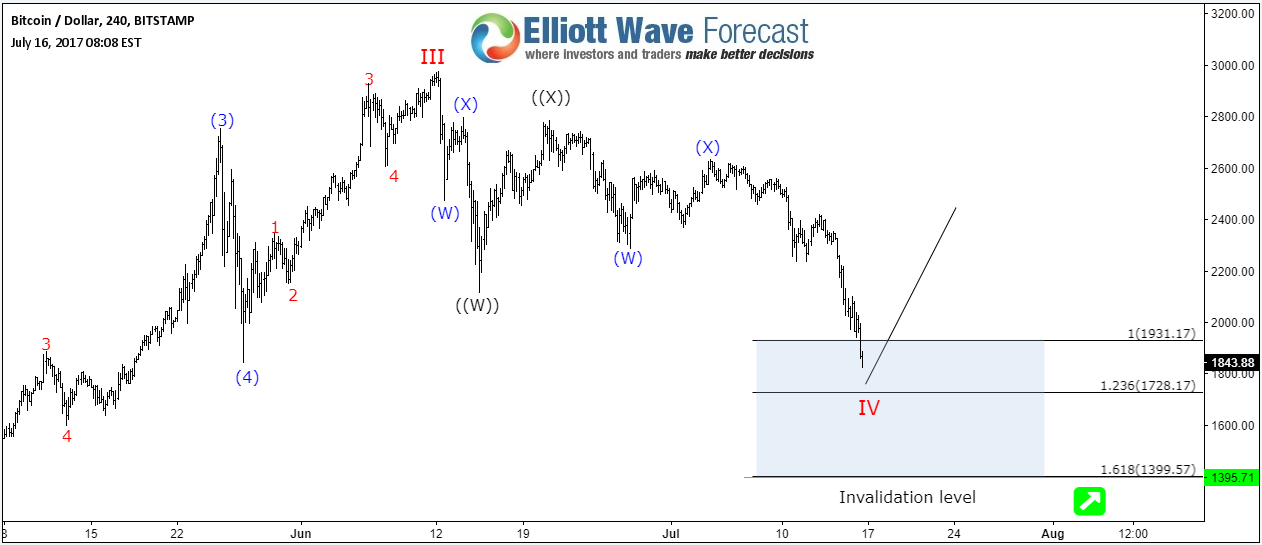
WXY is one of the most common patterns in the new adaption of Elliott Wave Theory. This structure is commonly called double three Elliott Wave pattern. Market shows this structure very frequently nowadays in many instruments in almost all time frames. It is a very reliable structure by which we can make a good analysis. What is more important is that it can give us good trading inputs with clearly defined levels of invalidation and destination areas.
Consequently, BTCUSD has already reached the 100% – 161.8% Fibonacci extension area ($1900 – $1400) where we expect buyers to show up looking for a new move to the upside or at least a 3 waves bounce. But as long as the price fails to make new highs then it could be part of a larger corrective structure and it’s only ending the first leg of it.
Bitcoin ABC 8H Chart 07/16/2017
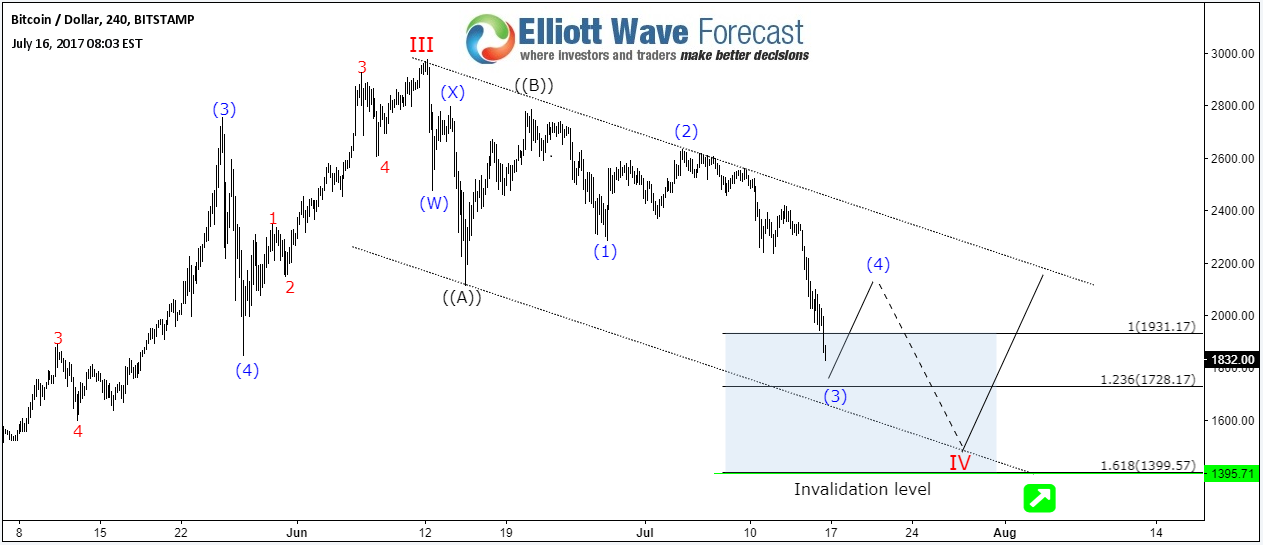
The structure can be counted in a different way if Bitcoin is doing an ABC Flat structure, which is another common type of correction that can be sometimes hard to trade because it tends to extends beyond the 1.618 fib ext level. There is many other scenarios that can play out but i’m only presenting the two most aggressive ones to explain the current “deja vu” situation for BTCUSD.
Recap
Market condition has changed over the time, instruments can be trending higher or lower in series of 3 wave sequences rather than impulsive sequence and this can be frequently seen in the forex market. Bitcoin is no exception as it’s just another financial instrument leading the correction of the cryptocurrency market and still has the potential to rally to new all time highs. It won’t matter if it will do it from current levels or a lower area, what really matter is how you are willing to manage your position during such movement to protect your investment.
No one is perfect and we don’t claim to have 100% accuracy, but a system with high accuracy acts as a great trading tool because forecasting is a process of continuous adjustments. A waver (trader) needs to accept when an idea doesn’t work out and adjust to new data.
If you enjoyed this article, feel free to check our Technical Blog to read more posts. You can also take this opportunity and try our services 14 days for FREE to learn how to to trade forex, indices, commodities and stocks using our blue boxes and the 3, 7 or 11 swings sequence . You will get access to our current 52 instruments updated in 4 different time frames, Live Trading Room and 2 Live Analysis Session done by our Expert Analysts every day, 24-hour chat room support and much more.
