


Hello fellow traders. In this technical blog we’re going to take a quick look at the past Elliott Wave chart of OIL ( CL_F ) published in members area of www.elliottwave-forecast.com. In further text we’re going to explain the structure and to see how we forecasted the path. Let’s start with 4 hour chart.
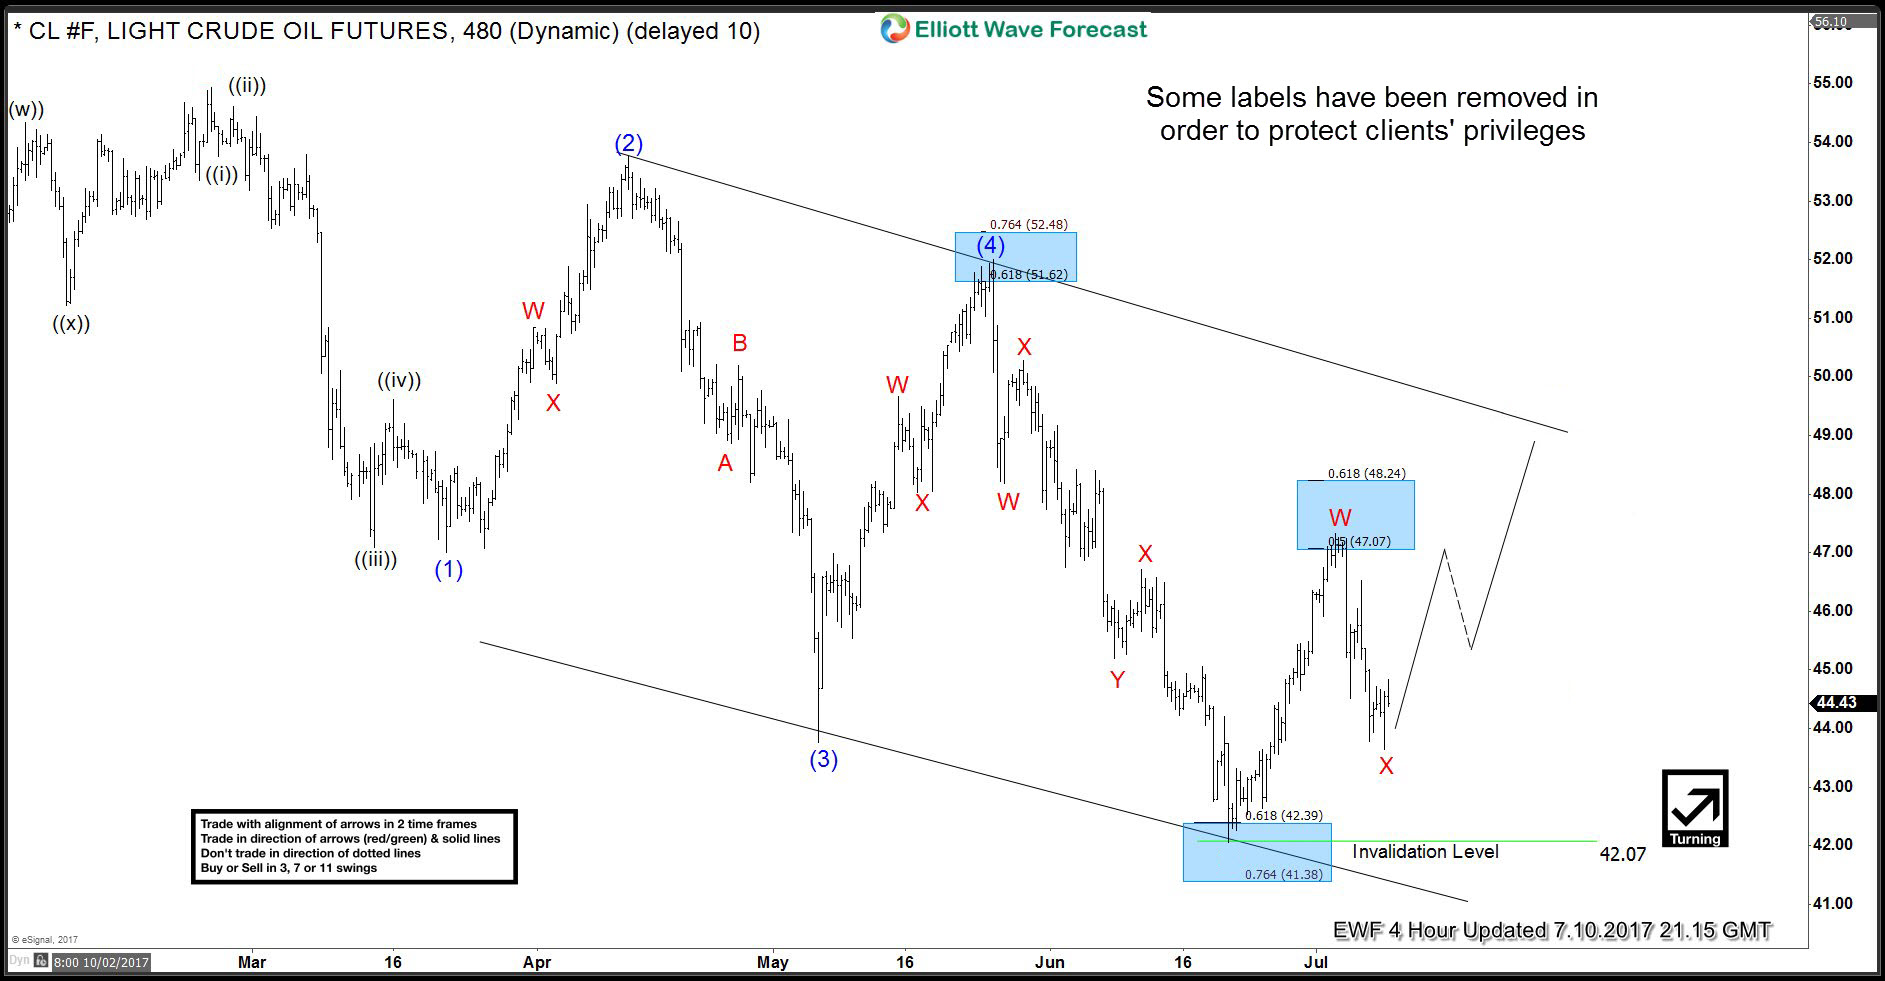
OIL ( CL_F ) Elliott Wave 4 Hour Chart 07.10. 2017
Our Elliott Wave forecast suggests that cycle from the December 2016’s peak has ended at 42.07 low. Consequently we’re expecting further strength in larger 3 wave bounce at least. The chart is calling X red pull back completed at 43.60 low, suggesting we’re already in Y red higher. We’re targeting upper line of down trending channel and more importantly W-X equal legs at 48.99-50.25 area
Now let’s go back 2 days and take a look at the smaller time frame to see how we forecasted potential reversal area.
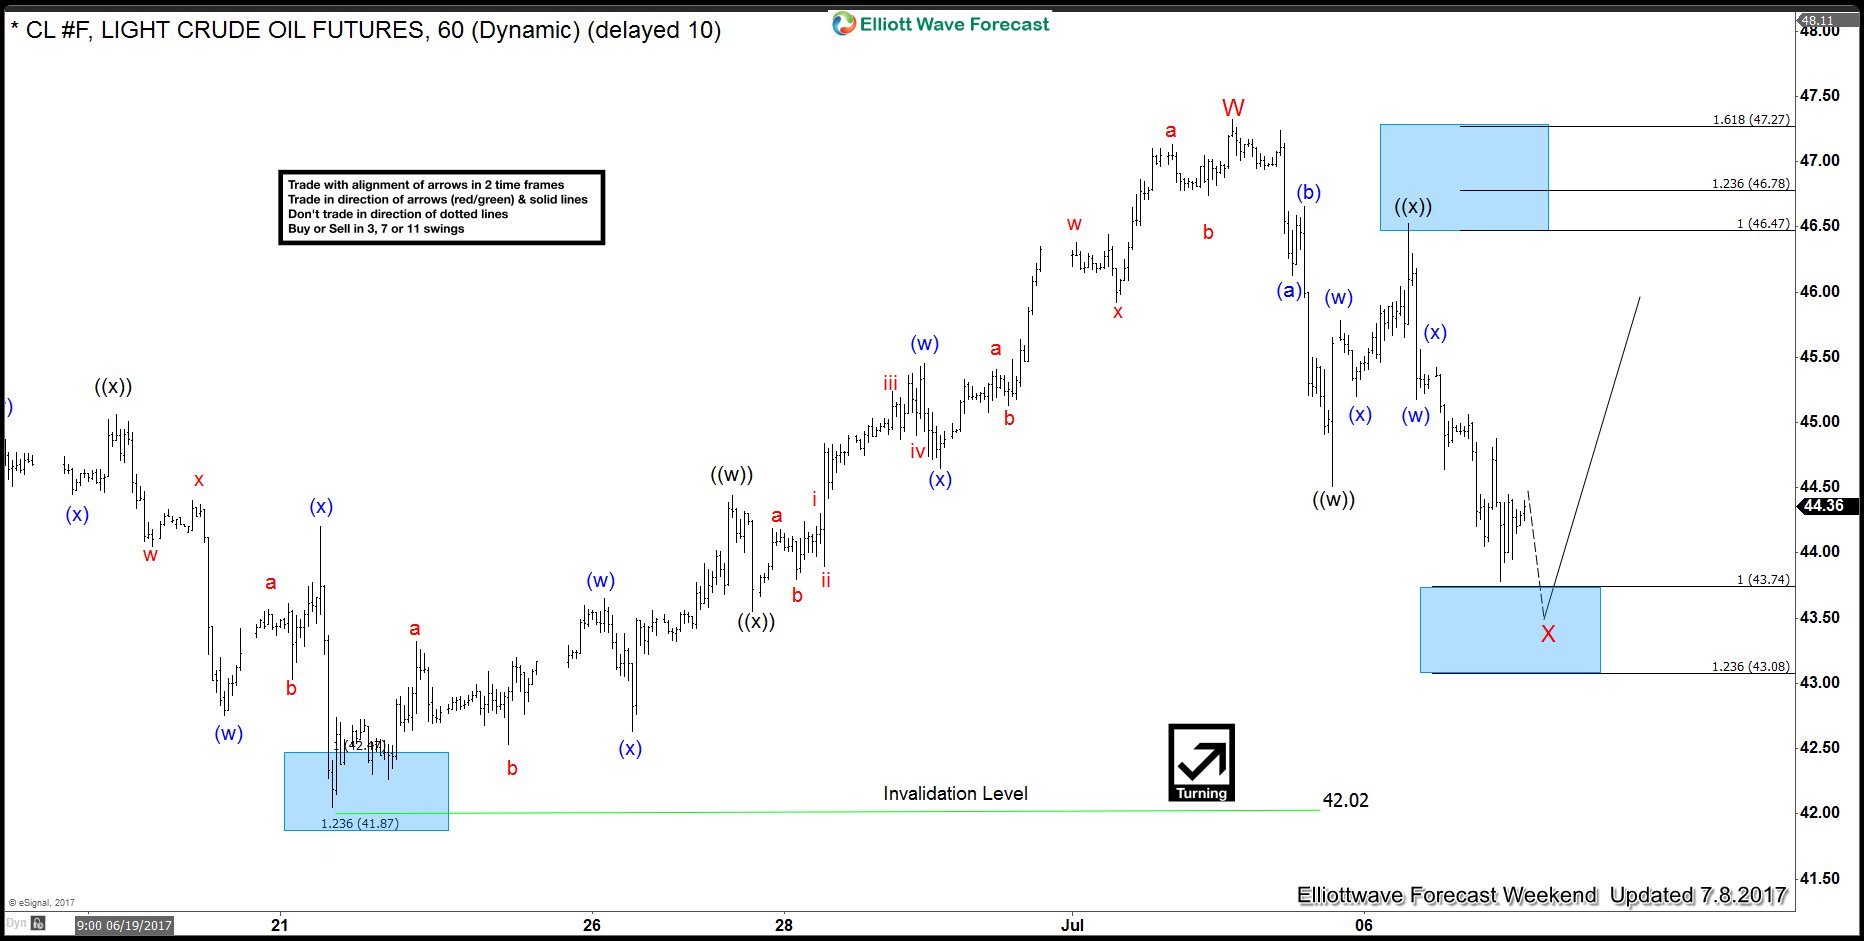
OIL ( CL_F ) Elliott Wave 1 Hour Chart 07.08. 2017
Oil is doing wave X red correction against the 42.02 low. We expect it to complete at short term technical area: 43.74-43.08 and find buyers for further rally. As far as 42.02 pivot holds we expect OIL to trade higher.
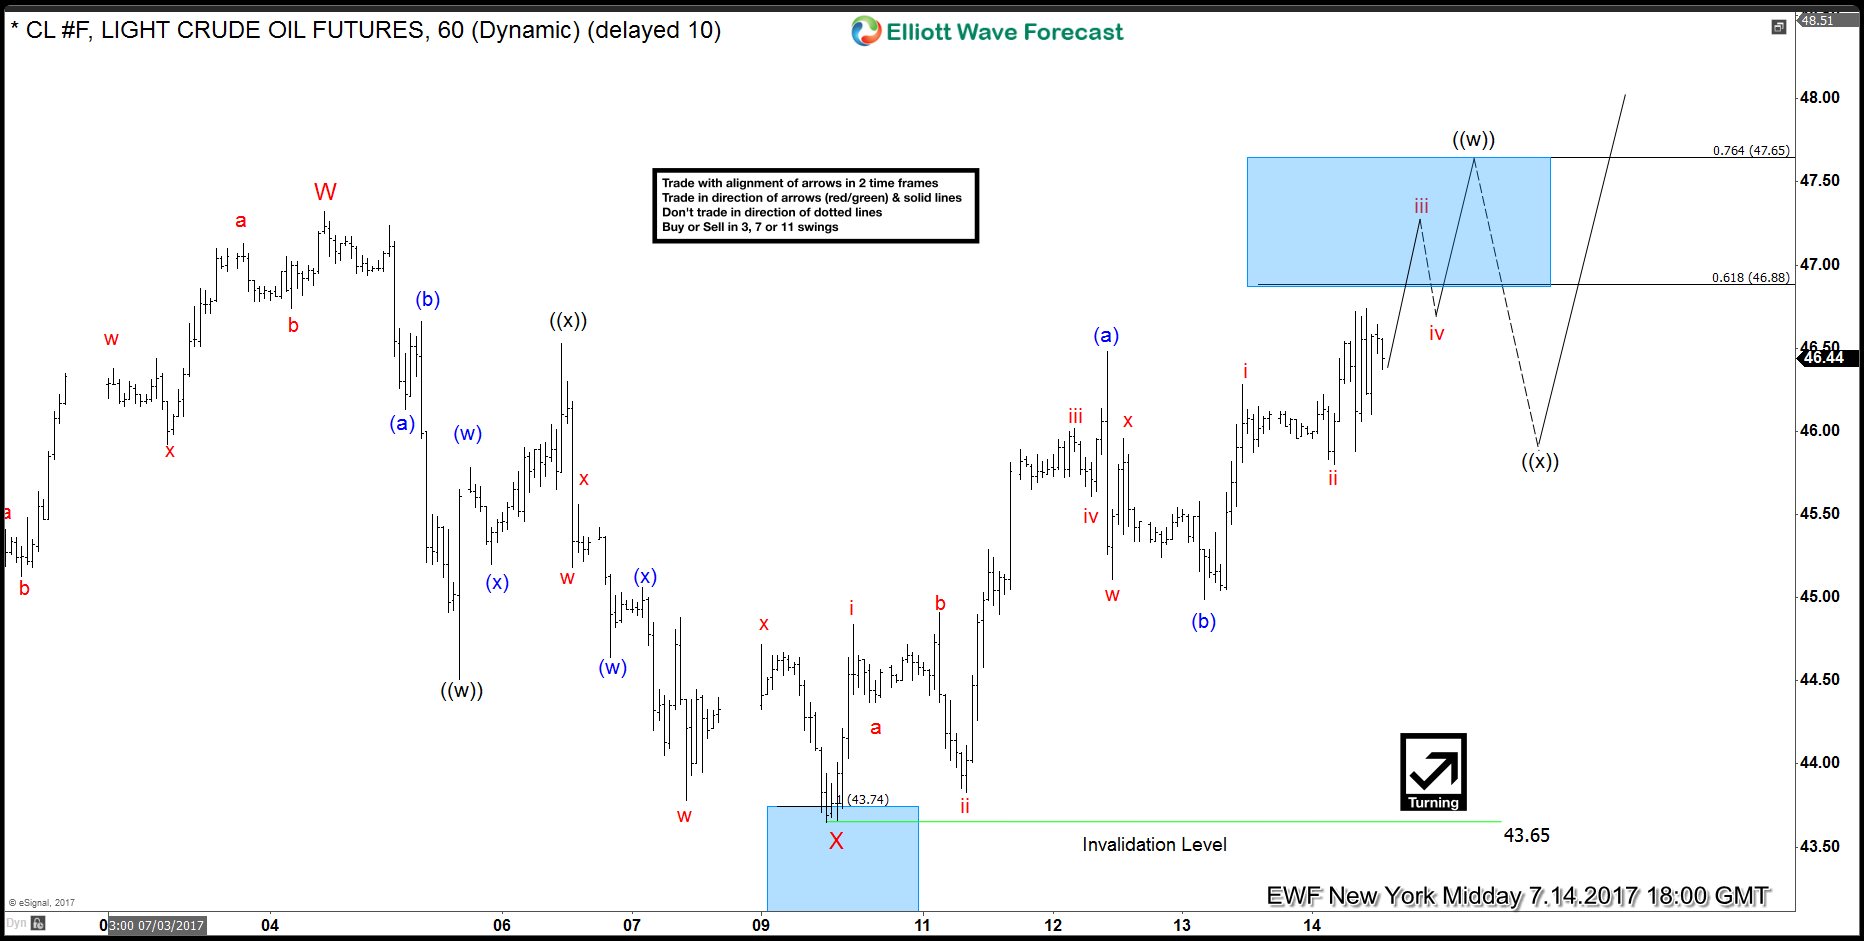
OIL ( CL_F ) Elliott Wave 1 Hour Chart 07.14. 2017
Commodity found buyers right at the blue box, completed X red pull back at 43.65 low and gave us nice rally. It’s heading toward 0.618-0.764 Fibonacci extension at 46.88-47.65, that can produce 3 wave pull back ((x)) before rally resumes. We would like to see break above W red peak 07/04 to confirm proposed bullish view.
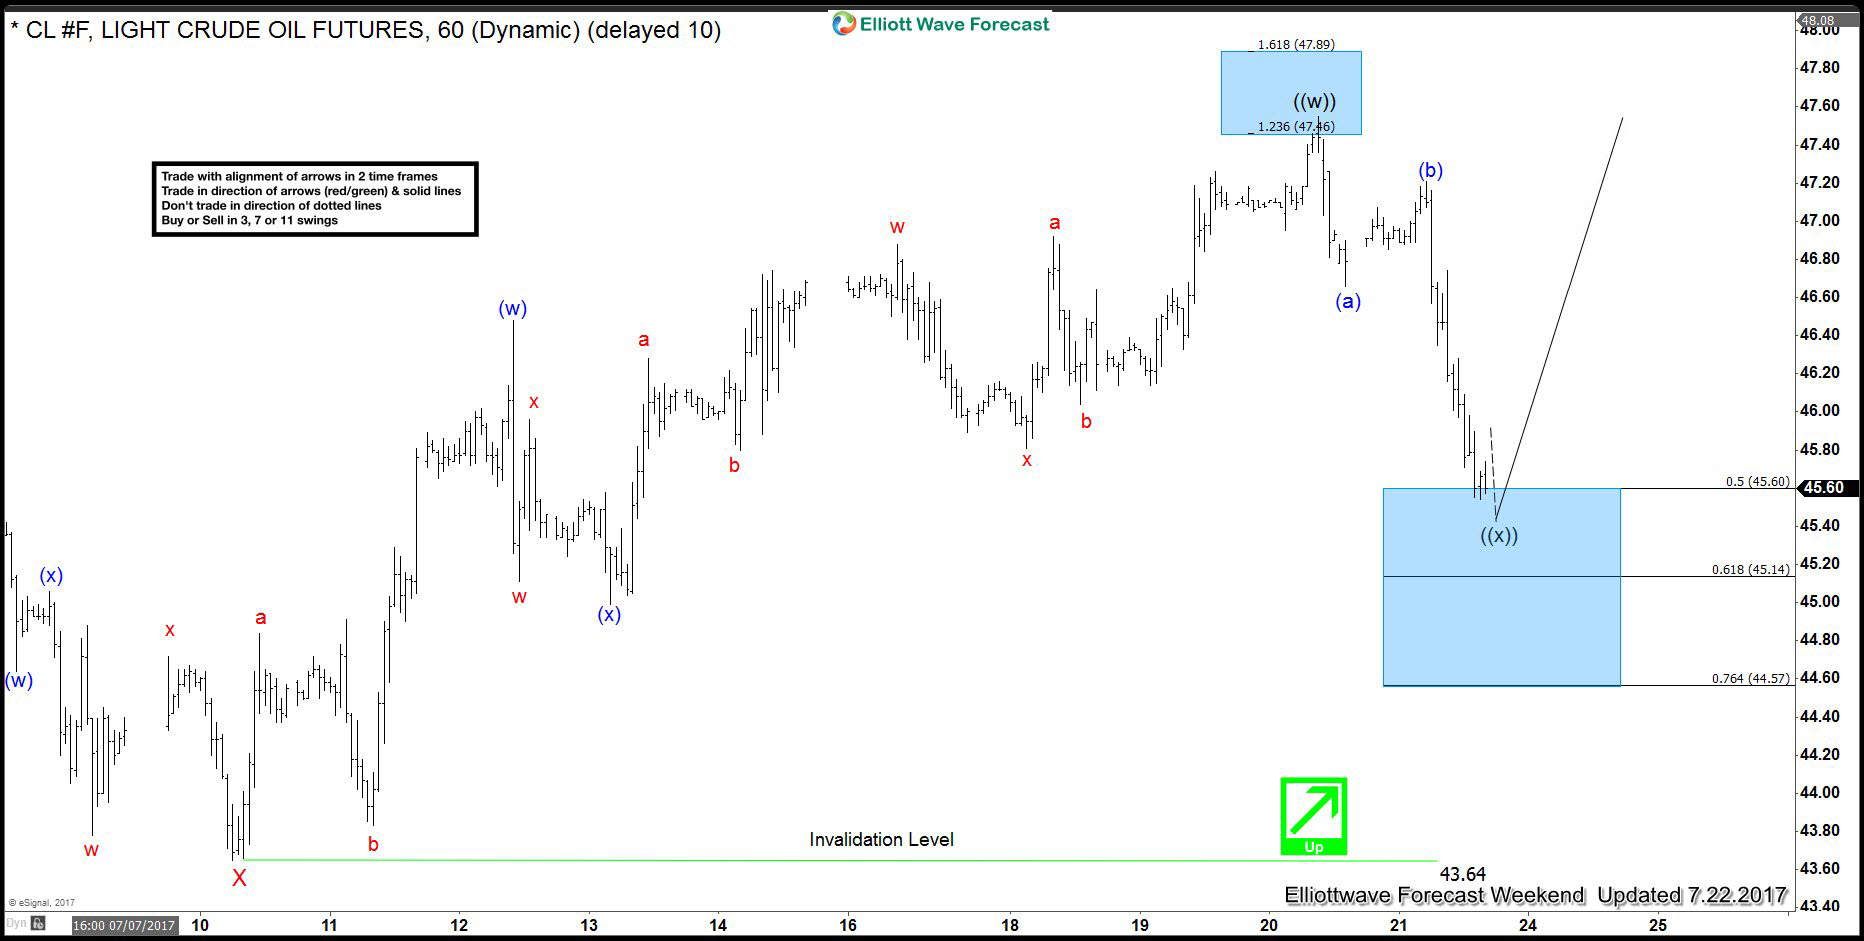
OIL ( CL_F ) Elliott Wave 1 Hour Chart 07.22. 2017
In the mean time Oil has made the new high as expected. Currently it’s giving us ((x)) pull back from mentioned area , correcting the cycle from the 43.64 low. Currently at 50-61.8 fibs : 45.60-45.14 where it should find buyers again.
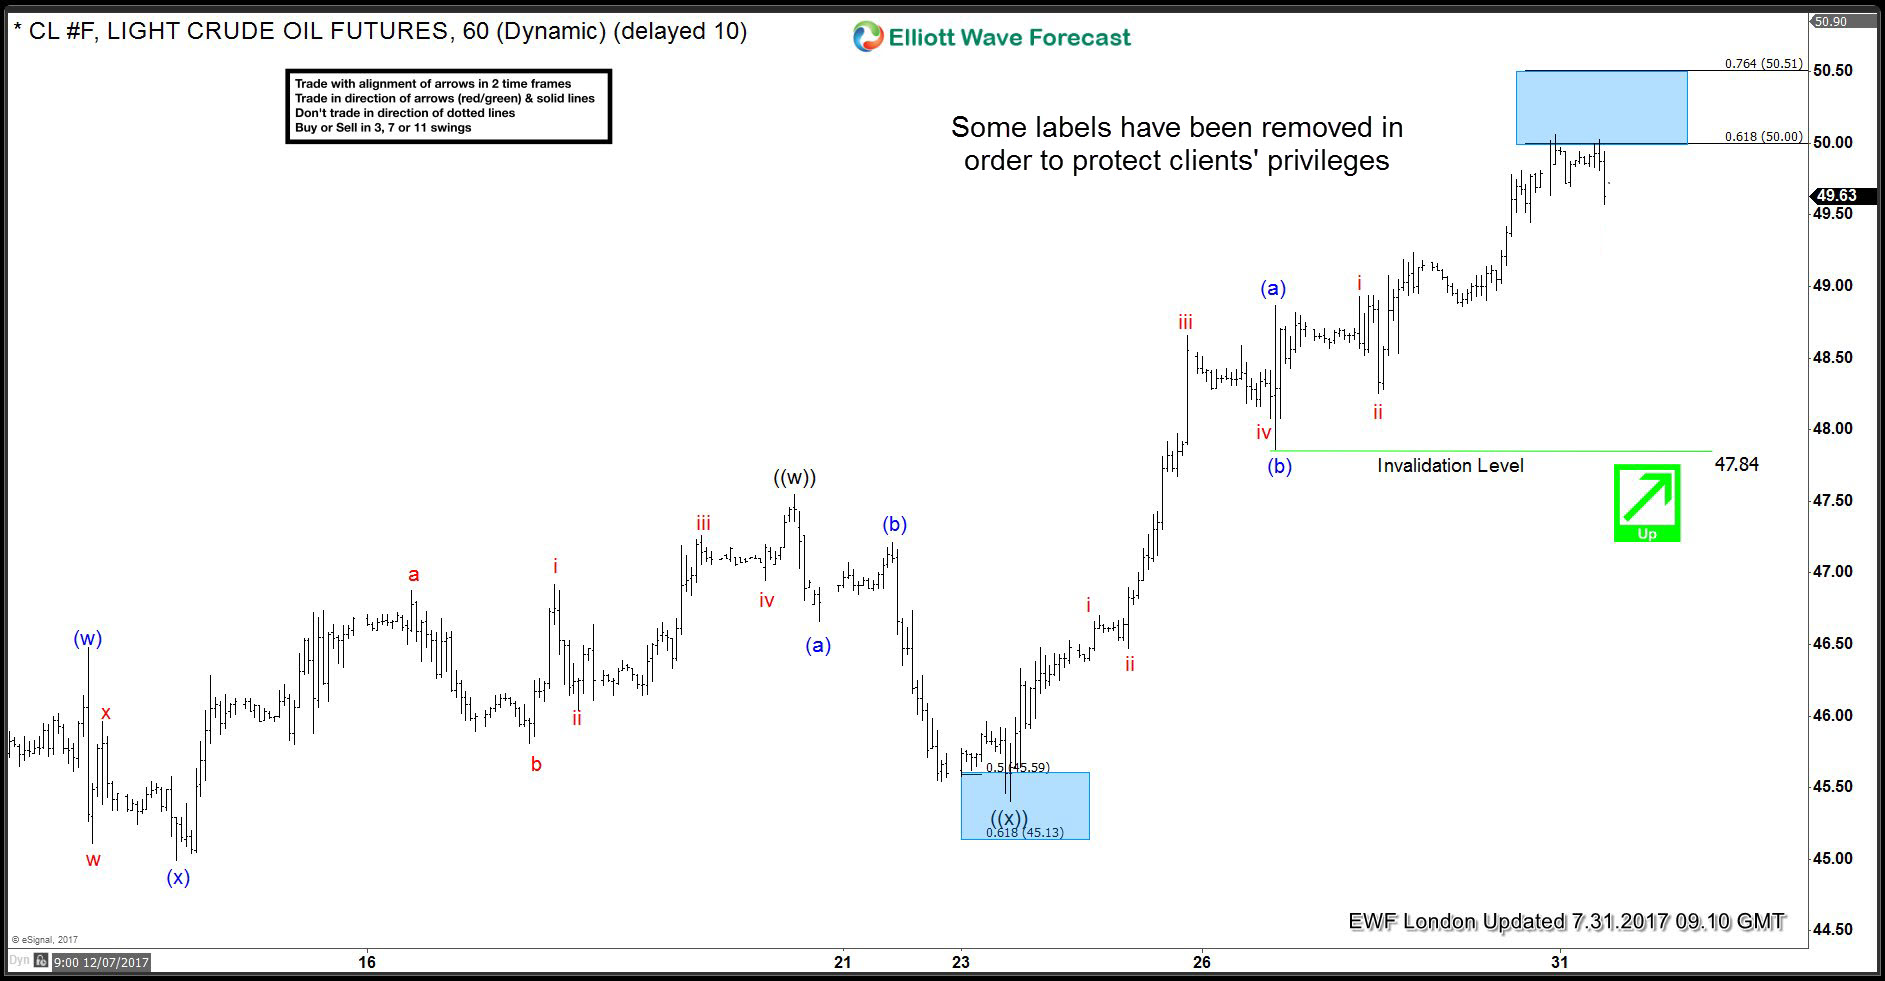
OIL ( CL_F ) Elliott Wave 1 Hour Chart 07.31. 2017
Oil completed pull back at proposed 50-61.8 fibs, and gave us further rally. Keep in mind market is dynamic. If you’re interested in the future path of OIL or any of the other 50+ instruments we cover, join us now. You can find Elliott Wave analysis in the membership area of EWF. If not a member yet, Sign Up for Free Trial now.
Elliott Wave Forecast
Through time we have developed a very respectable trading strategy. It defines Entry, Stop Loss and Take Profit levels with high accuracy and allows you to make position Risk Free, shortly after taking it, protecting your account. If you want to learn all about it and become a professional Trader, join us now for Free.
You will get access to Professional Elliott Wave analysis in 4 different time frames. 3 live Analysis Session done by our Expert Analysts every day. 24 Hour Chat Room support, Market Overview, Weekly technical videos and much more. Welcome to Elliott Wave Forecast.
