
What Causes Recessions? A Physicists’ Complex Systems Model
I received some very interesting comments from Yaneer Bar-Yam to my recent Evonomics post— “Capital’s Share of Income is Far Higher than You Think.” He pointed me to his very interesting paper, “Preliminary steps toward a universal economic dynamics for monetary and fiscal policy.”
I’m using this space to reply with with some thoughts that can’t display in that comments space.
I haven’t gotten to the full-boat, multipart reply that I have floating in my head, but wanted to get back on two items for the nonce, a question plus a response on recession prediction:
1. What is the function in this model that “causes” capital gains? This always strikes me as the core problem in a complete SFC model where flows (including holding gain “flows”) balance to and fully explain (change in) net worth: if you can write a reaction function that predicts asset-price changes, you’re a very rich person… 😉
2. The recession-prediction based on investment/consumption ratio misses a bunch of recessions (false negatives). Contrasted here with a personal favorite: every recession since 1970 has been preceded by a year-over-year decline in real household total assets/net worth. (Including liabilities to arrive at net worth instead of just using assets adds no predictive value). Click for FRED.
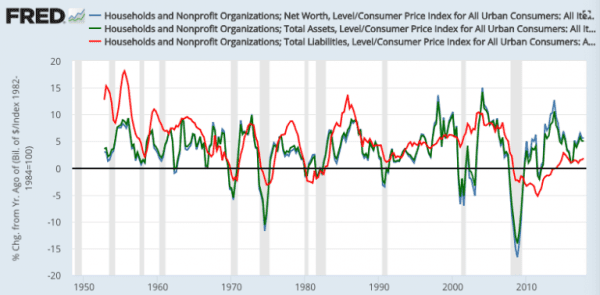
This predictor is seven for seven. Though: there are two recent false positives — shortly following the 2001 and 2008 recessions.
The investment:consumption ratio bruited as a predictor/cause in the paper is four for seven, and even there: the first year of decline in this ratio seems late in each case (as opposed to the measure’s peak) to suggest it as a cause:
| Investment:Consumption ratio peak/first year of decline | Year-over-year declines in real household net worth (CPI-adjusted; base year 82–84) | Quarters of real YOY net worth decline – YOY % decline in first declining quarter – NW decline peak-to-trough % | Beginning of NBER-dated recession |
| Q4 1969 – Q4 1970 | 4 – 3.9 – 5.6 | Q1 1970 | |
| Q4 1973 – Q1 1975 | 6 – 3.8 – 9.9 | Q1 1974 | |
| Q1 1980 – Q2 1980 | 2 – 1.5 – 1.4 | Q1 1980 | |
| 1981/1982 | Q3 1981 – Q2 1982 | 4 – 1.8 – 1.0 | Q3 1981 |
| 1989/1990 | Q3 1990 – Q2 1991 | 4 – 3.2 – 1.9 | Q3 1990 |
| 2000/2001 | Q4 2000 – Q4 2001 | 5 – 2.0 – 8.1 | Q1 2001 |
| Q2 2002 – Q1 2003 | 4 – 1.8 – 5.2 | ||
| 2007/2008 | Q4 2007 – Q3 2009 | 8 – 3.8 – 19.3 | Q1 2008 |
| Q3 2011 – Q4 2011 |
I have various ideas and explanations for all this, but apologies, haven’t found time to write them all up.


