
Z1 Update To Money, Credit, And Thus Economy
The Federal Reserve updated the Financial Accounts of the United States (Z1) yesterday, meaning there is quite a lot of new data for the second quarter of 2017. It also means more than just that update, as each quarterly addition is often accompanied by revisions to past estimates.
There were some substantial downward revisions to things like Corporate Net Worth, which impacts some equity valuation calculations. In short, stocks are even more expensive than we already thought they were (more on that next week).

Today we want to focus more on money and credit. The reason for the lack of economic growth since 2007 isn’t hard to discern. Money supply in the eurodollar forms has been left somewhere between not growing and often contracting. This wholesale part of the money system acts as an enormous drag on credit, which forms the great middle between money and economy (active liquidity preferences).

As expected, the Z1 statistics show that credit growth overall remains extremely low. Combined loans plus debt securities, the overall credit market grew at a 3% year-over-year rate in Q2. That compares to the 8-10% prevailing during the housing mania.
Even that 3% growth rate is overstating credit expansion, however. It includes in the US the heavy contributions of the federal government in borrowing at enormous rates since 2008. Economists particularly of the Keynesian variety will claim a number of “jobs saved” for it, but we know better especially given the continued economic stagnation (and worse).


It helps explain why the recovery, such that it was, was so weak from the very start. The only credit contribution came via the federal government borrowing so heavily and then wasting it on the ARRA. By the time the credit market overall awoke from the shock of 2008, it had already been hit with a second liquidity/money shock in 2011.
The data shows that it is in the private bank and financial parts that matter far more for determining the marginal economic circumstances (undercutting the argument that all activity wherever derived is the same aggregate demand). Both the domestic contributions (Depository Institutions) as well as that from foreign sources (ROW, or Rest of World) follow the “reflation”/downturn cycle. Given the nature of these liquidity events (eurodollars, meaning primarily offshore “dollars”) it isn’t surprising that the ROW section is growing by less than the domestic financial sector, almost zero again in mid-2017.


Combined, private financial credit market growth has this year weakened once after only a brief and stunted rebound for parts of last year. At just 2.6% year-over-year in Q2 2017, that’s down from 3.3% growth in Q1 and a recent high of 4.5% in Q3 2016 just prior to the full market effects of this “reflation.” And like we find in various money and bond curves, that peak was appreciably lower than the high point from the cycle just prior; growth in Q2 2014 was 7.3%.


These “reflation”/downturn cycles are followed closely by the major economic variables including inflation. When the private money sector both domestic and foreign is on the rebound, so too (with a bit of a lag) is the private economy (US & global). And when it turns downward again, as it has this year, we find the same deceleration and drag in real economy growth tendencies.


The cycle changes from one direction to the other, downturn to rebound and back again, are dictated by monetary events that alter further (meaning raise) liquidity preferences in the credit market. Quite naturally where such preferences are already high, marginal changes in the liquidity environment should have an impact on credit growth (though the “rising dollar” cycle was felt more so overseas it still ended up a serious enough disruption domestically).

The reason for these liquidity preferences is just as simple if misunderstood or undiscovered in the mainstream. Despite rhetoric about “money printing” and the like via QE’s or other forms of balance sheet expansion elsewhere, the wholesale banking system remains the only balance sheet whose dimensions actually matter.
In our crude measure of wholesale money (mostly interbank stuff), MW, there was enormous contraction during the panic and then no rebound at all after it. The general outline of this statistic is matched by others such as TIC’s estimates for more traditional cross-border dollar relationships centered on banking.

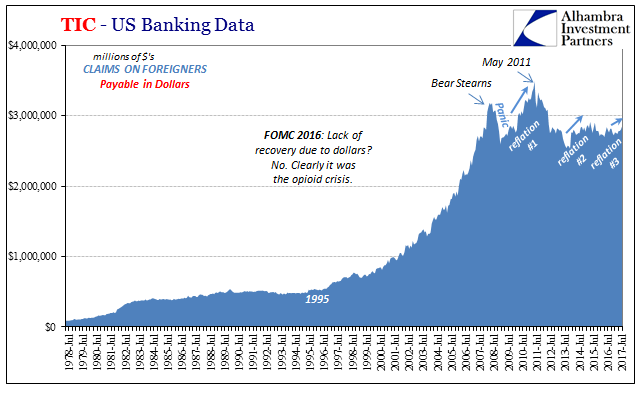
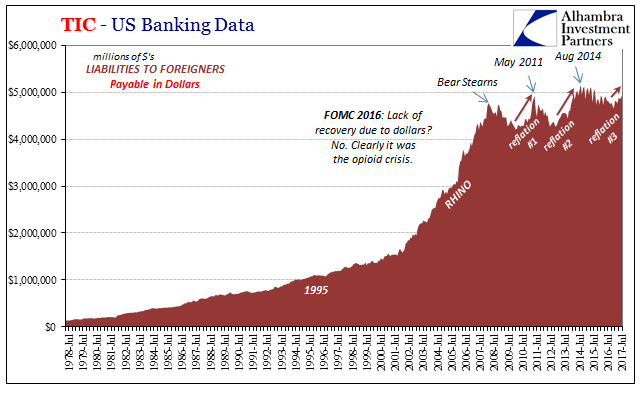
The benefit of the MW series is that it adds domestic wholesale elements to what in the TIC data is exclusively offshore related dimensions. Neither is, however, a complete view of what is actually out there in total (the often strange stuff of imaginations that never find their way fully into any numbers anywhere).
For the credit market, traditional money growth is occurring or has occurred as a result of monetary policy whose effects are either muted or missing altogether. MW shows us the general outlines for why that was/is.

It all adds up to a malfunctioning monetary system, credit growth often predicated on government activity, little in the private sector, and thus a real economy that falls further and further behind. And these are not the exclusive results of monetary instability, either. In other words, money capacity does have a direct relationship with the economy, too, and therefore can act as a drag outside of reduced or decelerating credit.
The Q2 2017 Z1 update is consistent with what we have already observed in market prices and curves – retrenchment or anti-“reflation.” It is therefore more corroborative data for the interpretation of those curves and prices. The Fed can’t figure out inflation or growth, but it really isn’t difficult just using the statistics it provides.
Disclosure: None.


Good article and nice graphics. You can print as much money as you like but the real issue is credit worthiness which has not improved due to not much change in salaries, lower income earning from investments (dividends not capital appreciation), and already burdened homeowners who can't save. Sadly not just to government but businesses have been binging on credit. And we all know both of these are not sustainable, especially businesses when they don't invest in capital equipment and expansion but engage in stock buybacks and dividends to support stock prices in the short term instead.