
Yield Curve Inversion Can Cause A Crisis Through Reflexivity
The reflexivity theory assumes markets cause changes to the economy instead of merely reflecting changes to the fundamentals. The most recent example of this is the collapse in oil prices from 2014-2015. The oil price decline occurred because of supply and demand issues. However, its decline was also part of the reason manufacturing weakened so much. On an individual company basis, a soaring stock price can allow the company to hire the best workers, have cheap financing, and grow market share. Instead of leading with a great business, a founder can lead with a great idea which isn’t profitable. If the founder can keep investors believing in the idea, he/she can make it happen.
This idea that sentiment drives reality is working in late 2018. Investors are concerned with the yield curve, making it one of the primary factors in our view that’s causing the selloff in stocks. Instead of using the indicator to forecast a recession, investors are selling before the curve even inverts (10 year – 2 year) because they think they know what will happen next. When everyone knows about an indicator, it can either cease driving alpha or speed up the process. Instead of forecasting a recession in over a year, it is causing weakness now.
As you can see in the chart below, the number of Google searches for the yield curve has exploded recently. That’s way more than when the curve inverted in 2006-2007. That’s the only other cycle we have search data on.
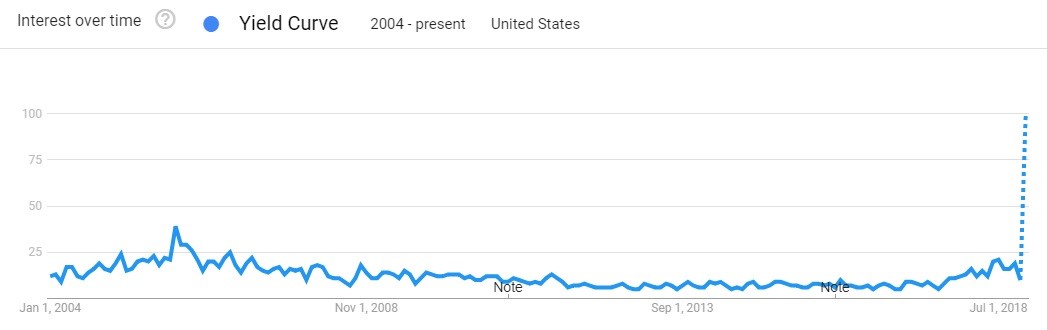
Source: Google Trends
Even though the 2 year yield being higher than the 5 year yield hasn’t historically caused problems, there never was a situation where so many investors, alongside the media, were glued to the curve and believed it causes problems.
Banks Too Scared To Lend After Inversion
Adding fuel to the reflexivity issue with the yield curve is banks have stated they will tighten lending standards if the curve inverts. To be clear, since banks lend long and borrow short, their margins are hurt by a flattening yield curve. We’re saying the curve is causing its normal problems and inspiring fear. This fear causes investors to sell their stocks, banks to pull back on lending, and consumers to spend less and save more.
The top chart below shows the banks that would tighten lending standards because of an inversion.
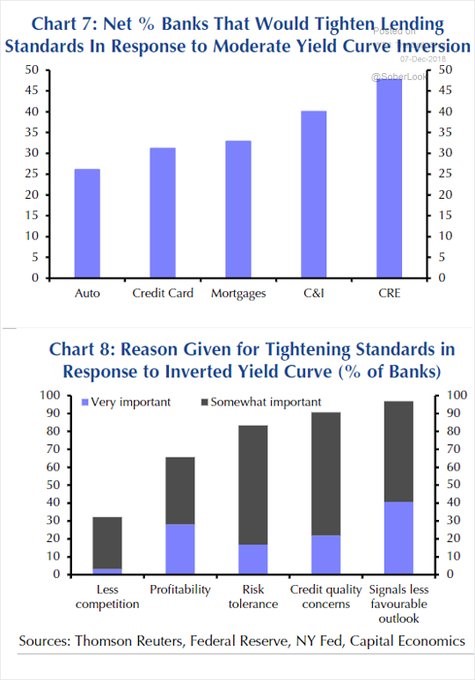
Source: Capital Economics
The bottom chart above shows the reasons banks gave for tightening standards. Both profitability and the outlook an inversion signals are very important. The outlook is even more important than profitability which means the reflexivity issue is more of a concern than a catalyst which hurts profits. The signal is becoming the catalyst.
Another Recession & Stock Market Indicator
The year over year change in the unemployment rate shows us the momentum of the economy. When the rate increases year over year, it’s a good indicator the economy is headed into a recession. As you can see from the chart below, there were two false warnings since the mid-1970s and the double-dip recession in the early 1980s never gave off the warning.
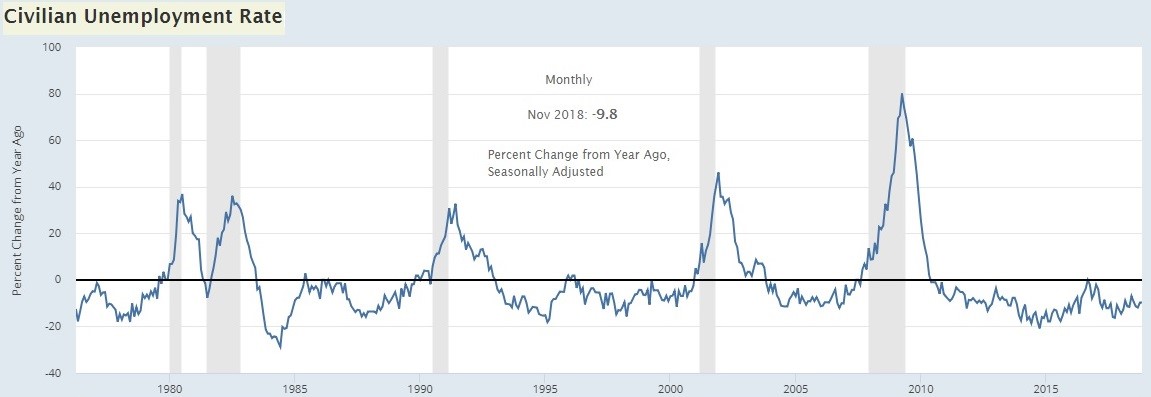
Source: FRED
The indicator moved positive 3 months before the last recession, 2 months before the 2001 recession, and 8 months before the 1990-1991 recession.
This indicator doesn’t give us much warning time prior to recessions which is why we need to watch out for it before it becomes positive. Currently, it is down 9.8% year over year as the unemployment rate of 3.671% is the lowest since December 1969. It would need to rise above 4.1% in March for it to signal an incoming recession. The economy is in the clear for now, but the rate is historically low. There’s not much room for it to fall, but there’s a lot more room for it to rise.
-9.8% Returns Per Year Coming?
Because a low unemployment rate means there’s not much room to expand and a lot of room to contract, stocks do terribly in this scenario. The chart below combines the CAPE ratio with the unemployment rate.
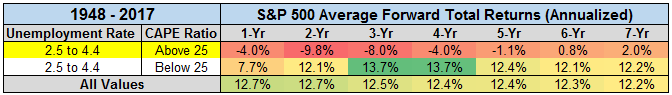
Source: Pension Partners
Historically, individually, a high CAPE ratio and low unemployment rate are bad for returns. Therefore, it’s not surprising that when you combine them, the returns are terrible. The current CAPE ratio is 29.37. When the CAPE is above 25 and the unemployment rate is in between 2.5% and 4.4%, 2 year annualized returns are -9.8%. The returns are negative every period up until 5 years. Even 7 year returns are only 2% per year. This confirms our recent article examining 5 year S&P 500 returns.
When Will The Labor Market Hit Full Employment?
There were 155,000 jobs created in November which means job creation was above the population growth. That means the labor market isn’t full yet. The average job creation of 208,000 per month in 2018 is about double the population growth rate. The closer the labor market gets to full unemployment, the more the Fed hikes rates which inverts the yield curve.
The Fed doesn’t need to hike rates because nominal wage growth hasn’t pushed core inflation higher. It’s a nirvana as nominal wage growth is strong, and commodities prices are falling. However, the Fed still believes the economy will overheat when the labor market is full which is why we still need to analyze it closely.
As you can see from the chart below, the prime age employment to population ratio is 79.7%. It didn’t increase in November.
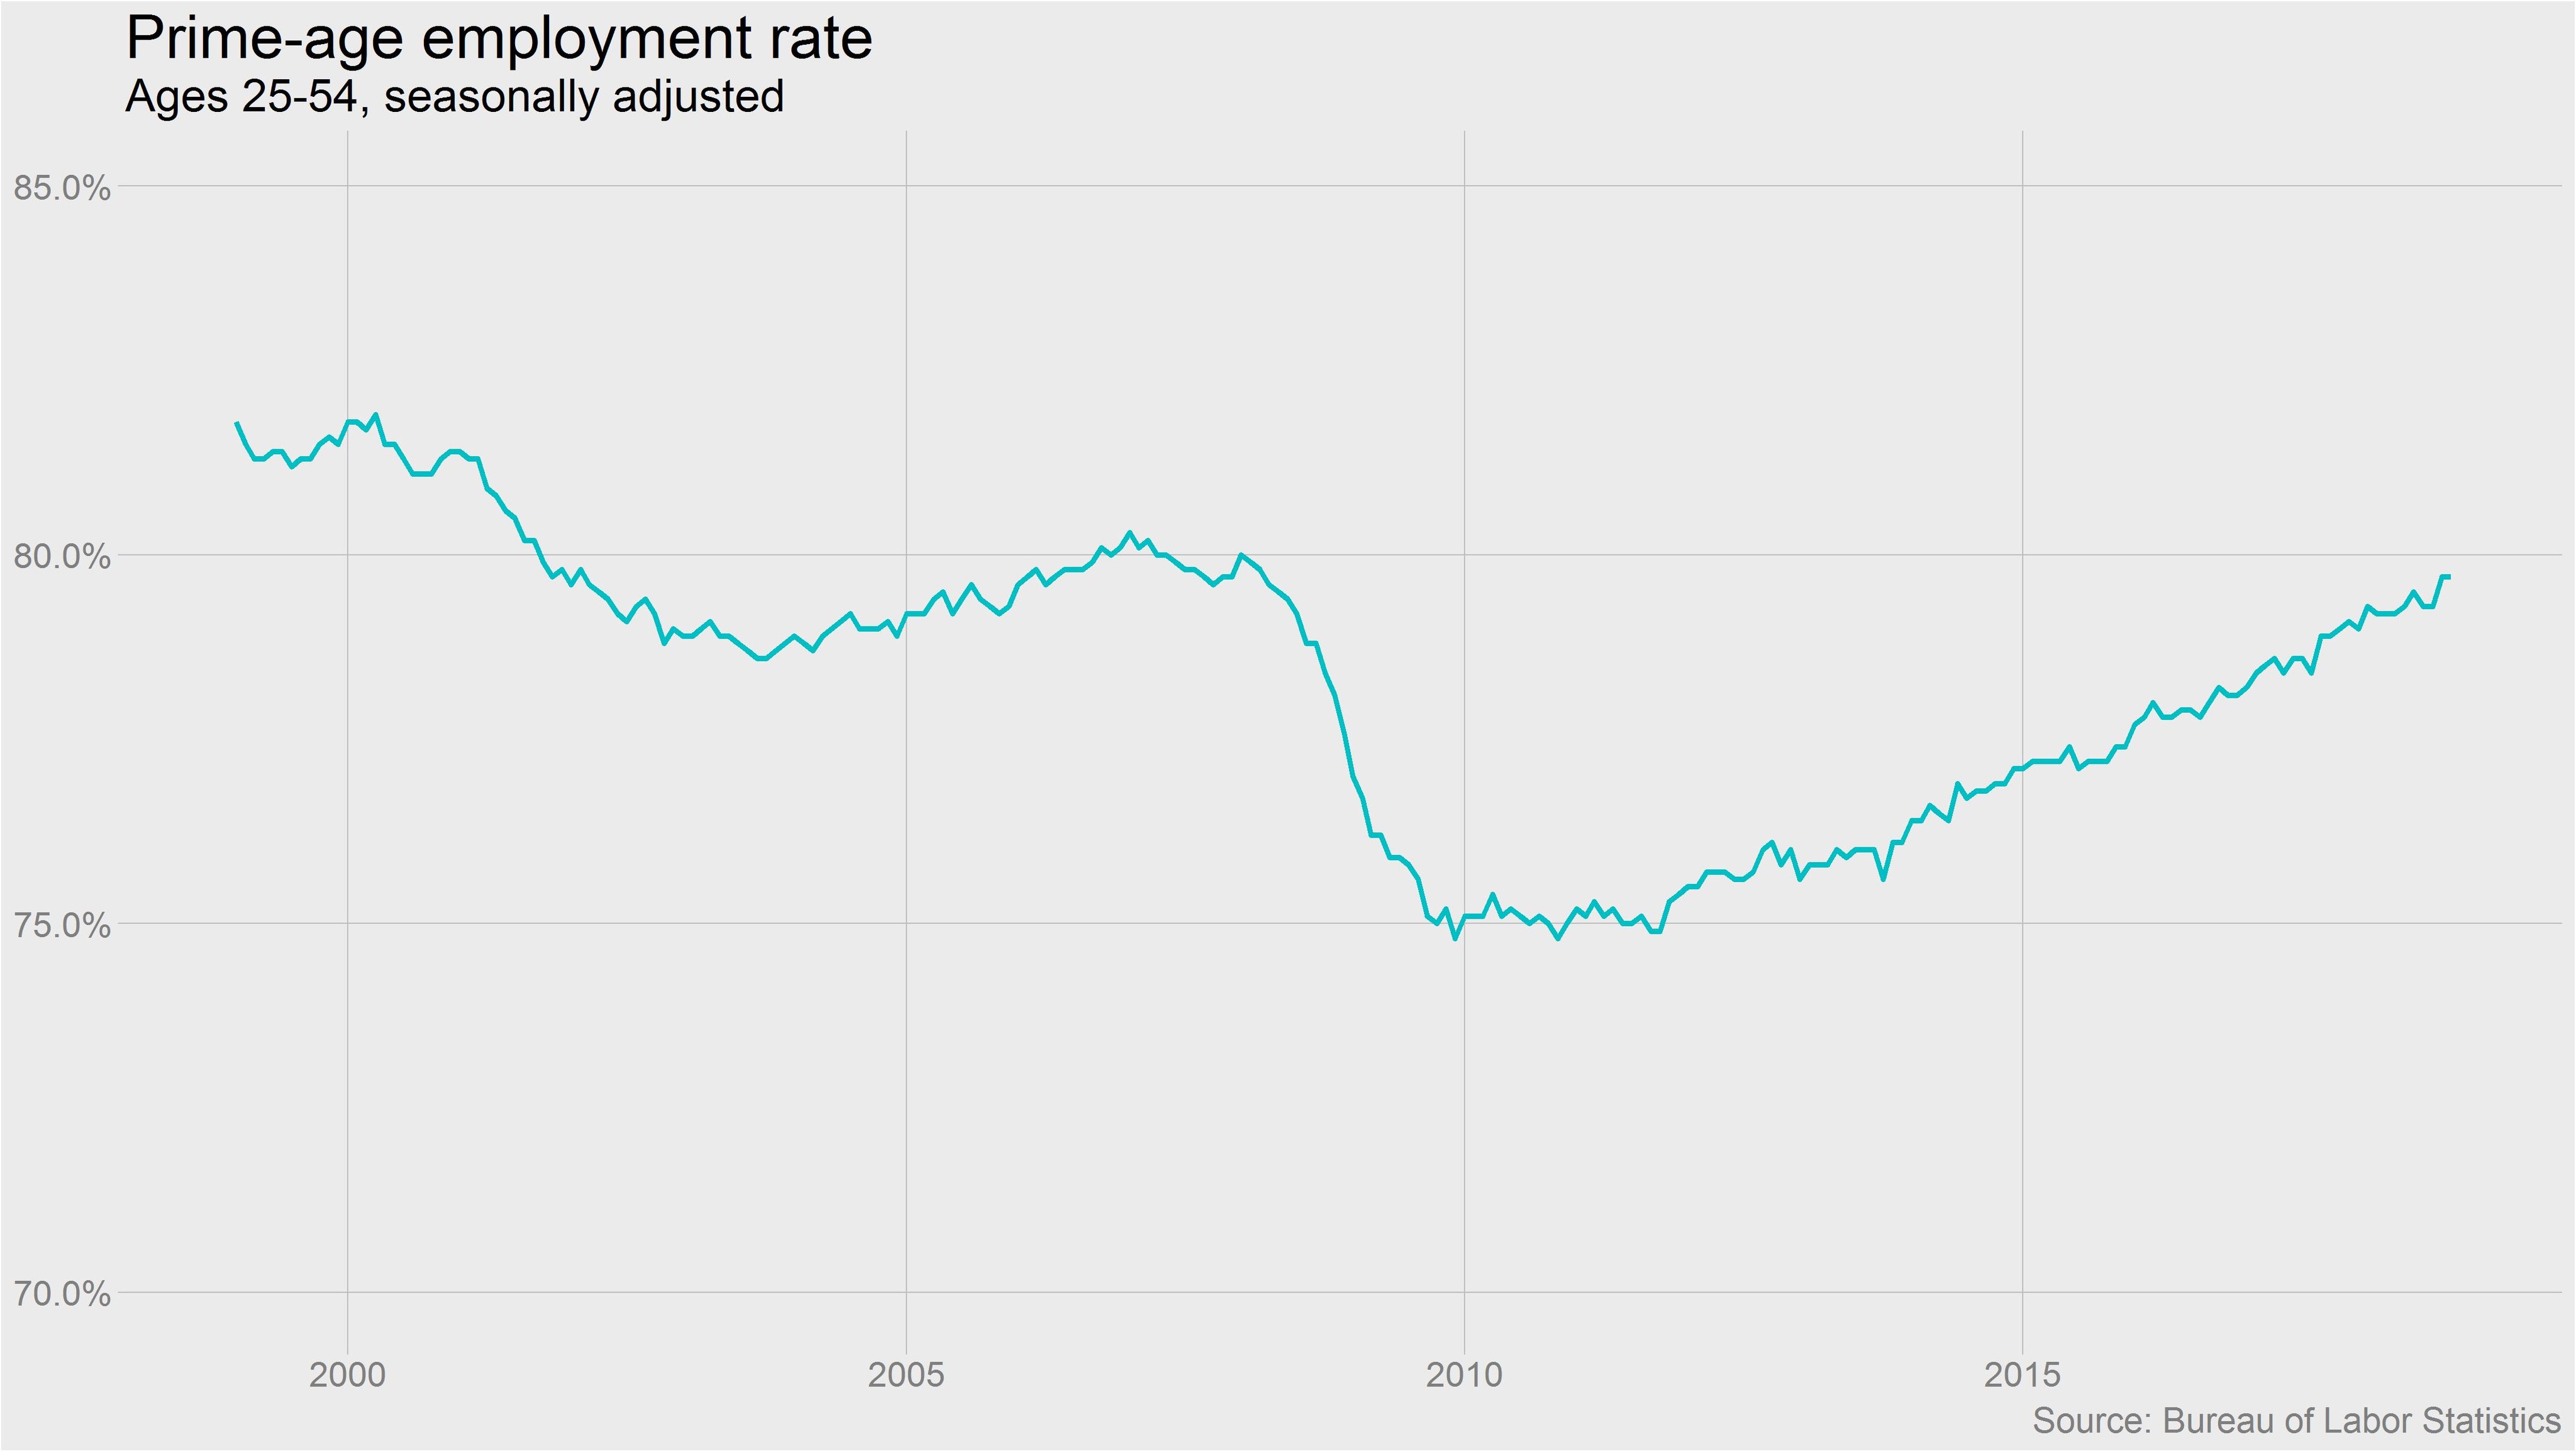
Source: Ben Casselman
Bullish investors want people to get jobs, but don’t want the Fed to invert the curve. On average, in the past 3 cycles this ratio has peaked at 80.8% which means it is 1.1% away from reaching full employment. Right on queue, the Fed is hiking rates in 2018 which is bringing the curve near an inversion.
Conclusion
The yield curve is usually a leading indicator, but its new-found popularity has made it a concurrent indicator due to reflexivity. The ISM reports are still strong, but those will quickly shift lower if the stock market keeps falling on recession worries. Firms will quickly change their tune when banks tighten lending standards. The Fed is raising rates because the labor market is approaching full employment even though the core inflation rate (PCE) is below its 2% target. If the Fed becomes dovish, the market might view that as a signal to panic. The Fed is either going to cause an inversion which will cause a selloff or pause hikes which will cause traders to wonder what is wrong with the economy.
Disclaimer: Please familiarize yourself with our full disclaimer here.


