
WTI Crude Oil Price At 15-Month Highs, Gold Accelerating
Crude Oil has traded at the highest level in 15-months on the third-largest inventory draw in 2016. Over the last seven weeks, crude inventories have shown a draw six times by more than 26 million barrels in aggregate according to Bloomberg. The impressive inventory draw was likely encouraged by reports out of Saudi Arabia’s Khalid Al-Falih, their Minister of Energy & Industry who said the division of production cuts would be fair and equitable for countries, and that many nations including Russia will join in supply cuts.
Gold prices continue to benefit from a weaker-USD after New Home Starts missed on Wednesday morning. The two-week high that Gold traded at on Wednesday aligns with the overall optimism in the commodity bloc as BHP, the world’s largest miner said that commodity markets are easing and China could help to bring demand that has been lacking. If Gold can hold its daily gains, it will be the heading for the highest intraday levels since October 5.
GOLD TECHNICAL ANALYSIS – The price of Gold broke above current resistance of the 200-DMA at $1,266/oz. We noted yesterday that on the Daily chart, there was an encouragement for the Bulls that the slope of the 200-DMA is positive. As the US Dollar falls for the third day, the price of Gold is seen benefiting. The key resistance appears to be the October 5 high of $1277.16/oz.
You can see the move that the move higher is merely into the 38.2% retracement of the Sept. 30-October 7 decline. $1,277/oz also brings about the zone between the 100% & 127.2% Fibonacci Expansion of the Oct. 7 low and the higher low on Oct. 14 of $1,245.96/oz. Given the resistance above, we still would be cautious in the short-term as we trade below the 127.2% expansion and Oct. 5 high at $1,275.91/77.16 respectively. However, the medium-term outlook continues to look favorable for further upside in spite of short-term worries.
(Click on image to enlarge)
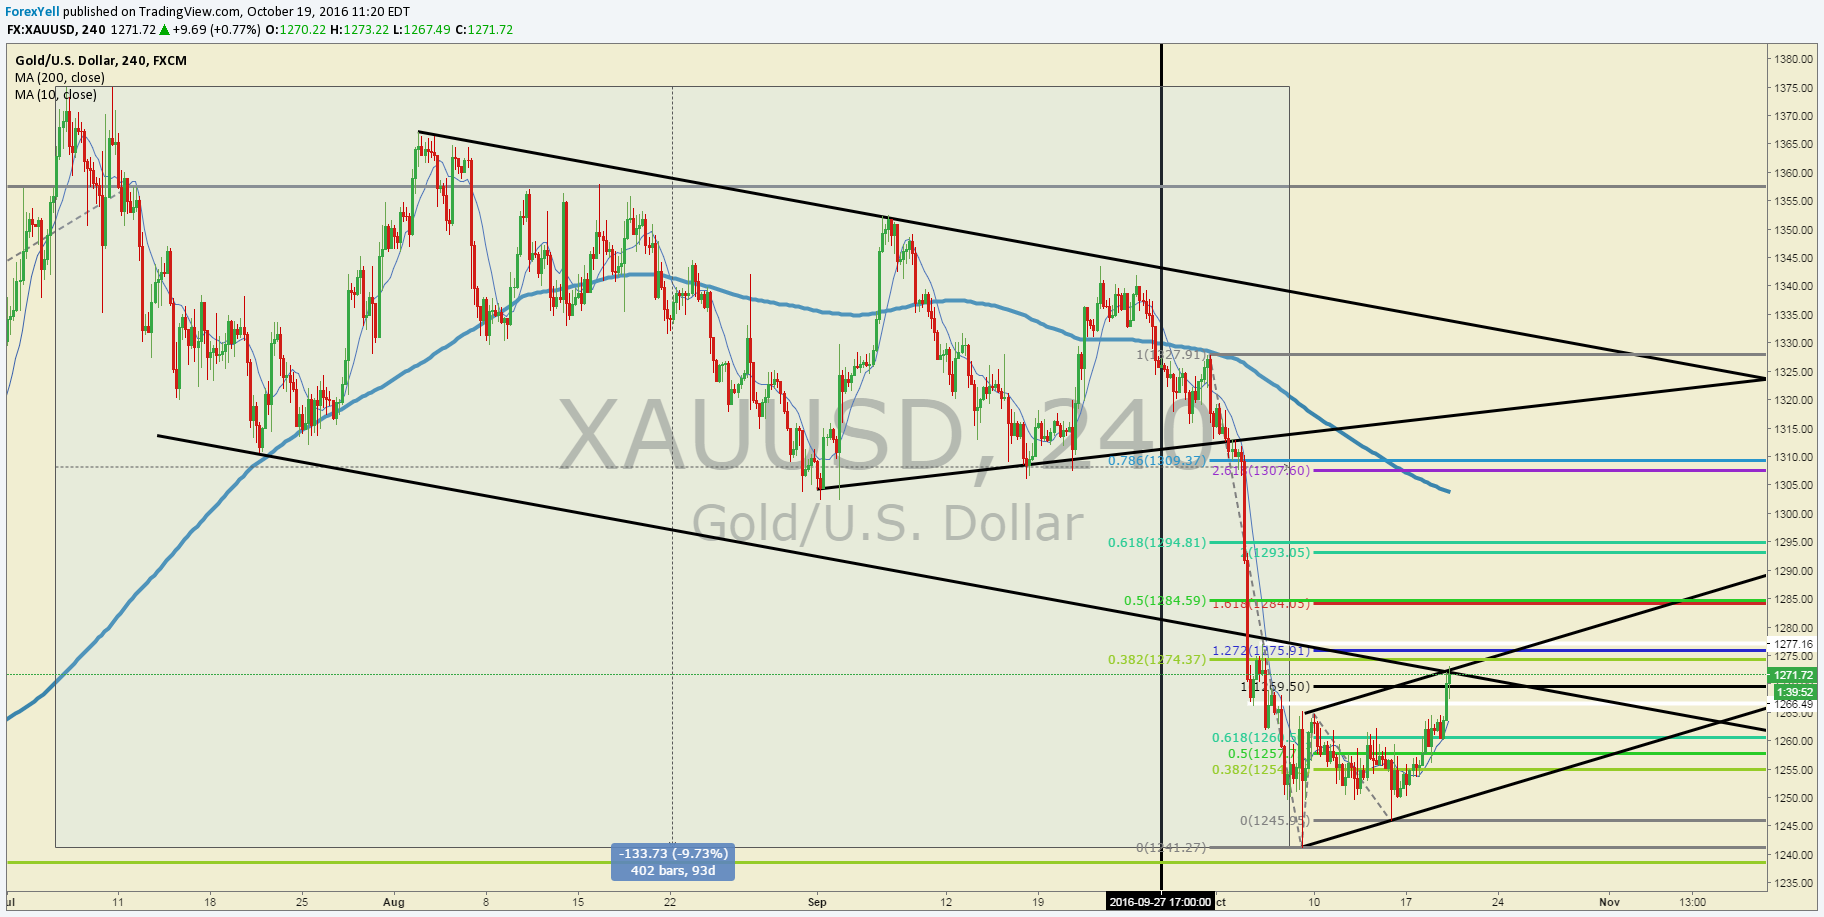
Chart Created by Tyler Yell, CMT. Courtesy of TradingView
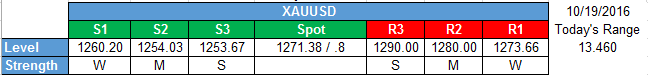
Short-Term Gold Price Support & Resistance Levels:
(Click on image to enlarge)
CRUDE OIL TECHNICAL ANALYSIS – The price of Crude Oil took a significant step toward the ~$52/bbl level that would initiate the Bullish Head & Shoulder’s pattern. Should the pattern play out, there would be a target for the ~$78/bbl range. Shorter-term traders finally saw a break from the multi-day triangle consolidation as the uptrend continued on the Wednesday’s EIA inventory report.
The price has now definitively pushed out of the Ichimoku Cloud on the H4 chart that would indicate the trend higher is resuming. This trend will be hard to fight as we enter into 15-month highs. Support will now be expected in the zone where the consolidation took place between $49.35-$51.12/bbl. Readers may remember how we shared that the 50-DMA crossed above the 100-DMA, which also occurred in April when Crude rallied ~20% before reaching the June 9 high at $51.64/bbl that we surpassed today. Naturally, this doesn’t necessarily imply a moon shot, but it does validate the shift in net-long positioning that we recently noted from the CFTC Commitment of Traders report.
(Click on image to enlarge)
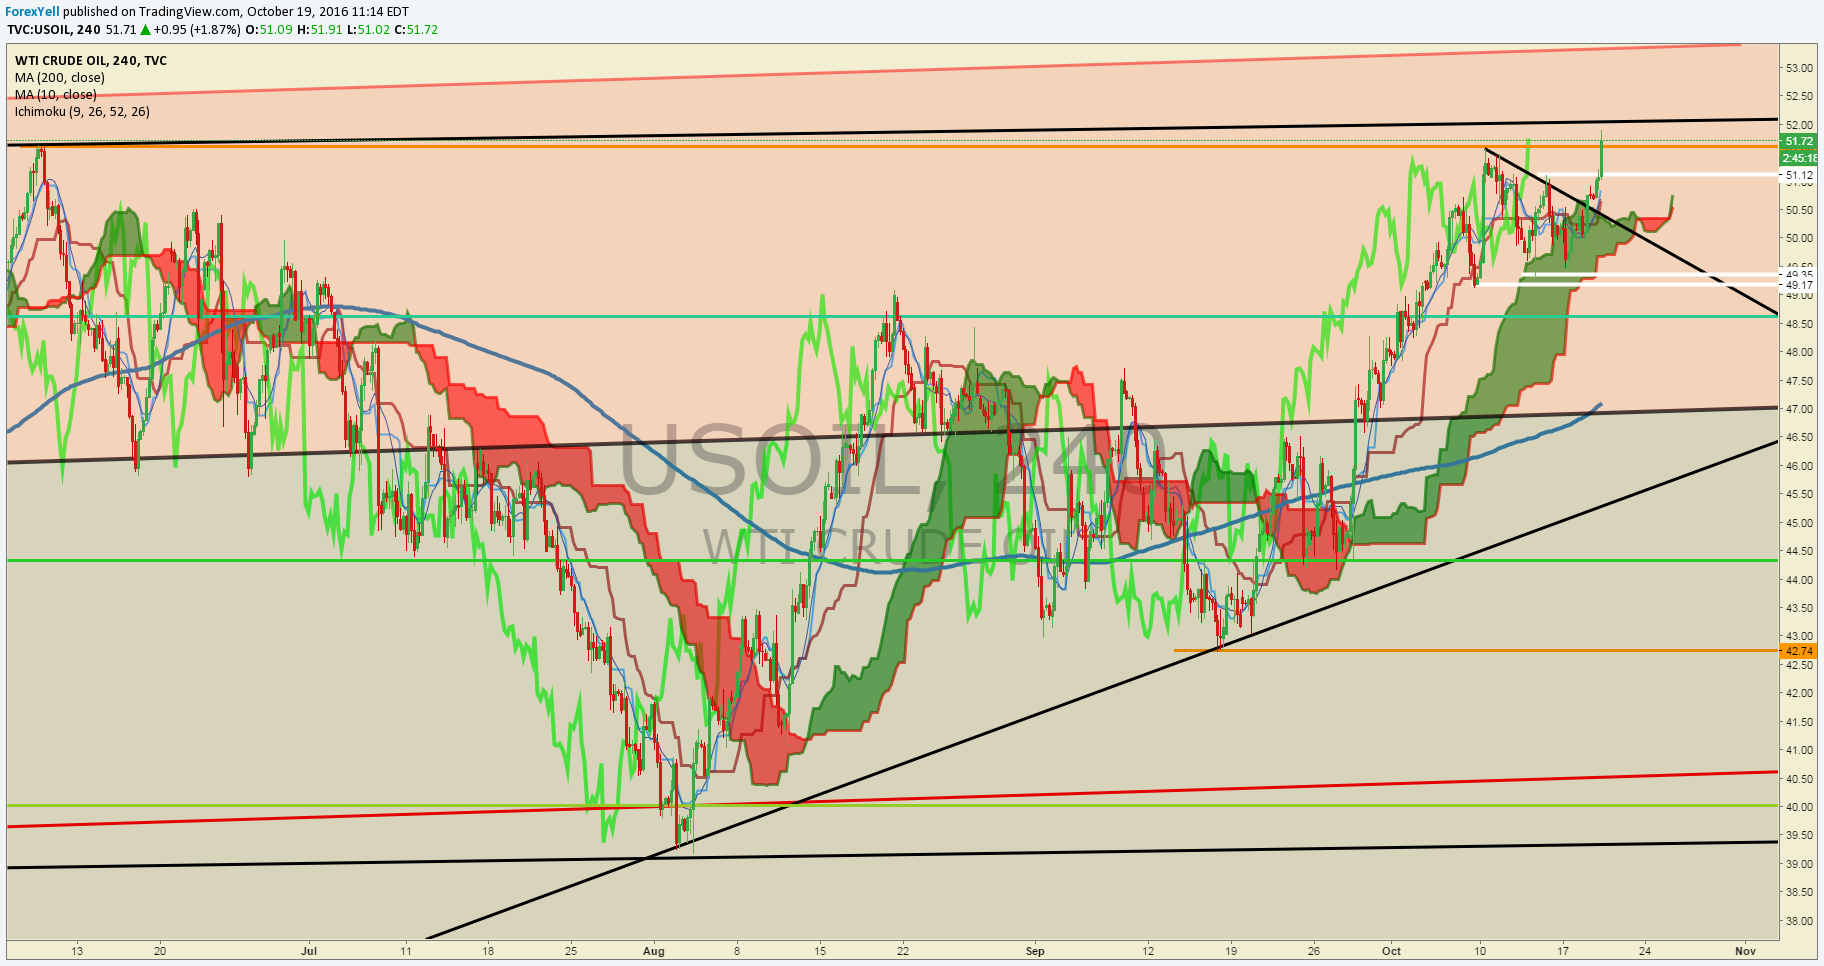
Chart Created by Tyler Yell, CMT. Courtesy of TradingView
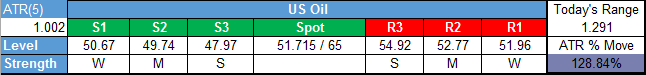
Short-Term Crude Oil Price Support & Resistance Levels:
For more analysis and trade setups (including current positions and the ‘watchlist’), more


thanks for sharing