
Will We See A Replay Of 2015 And 2016 In The Gold Market?
In both 2015 and 2016, the price of gold bottomed in December, as one can see in the chart below.
Chart 1: Gold prices (London P.M. Fix) from January 2015 to October 2017.
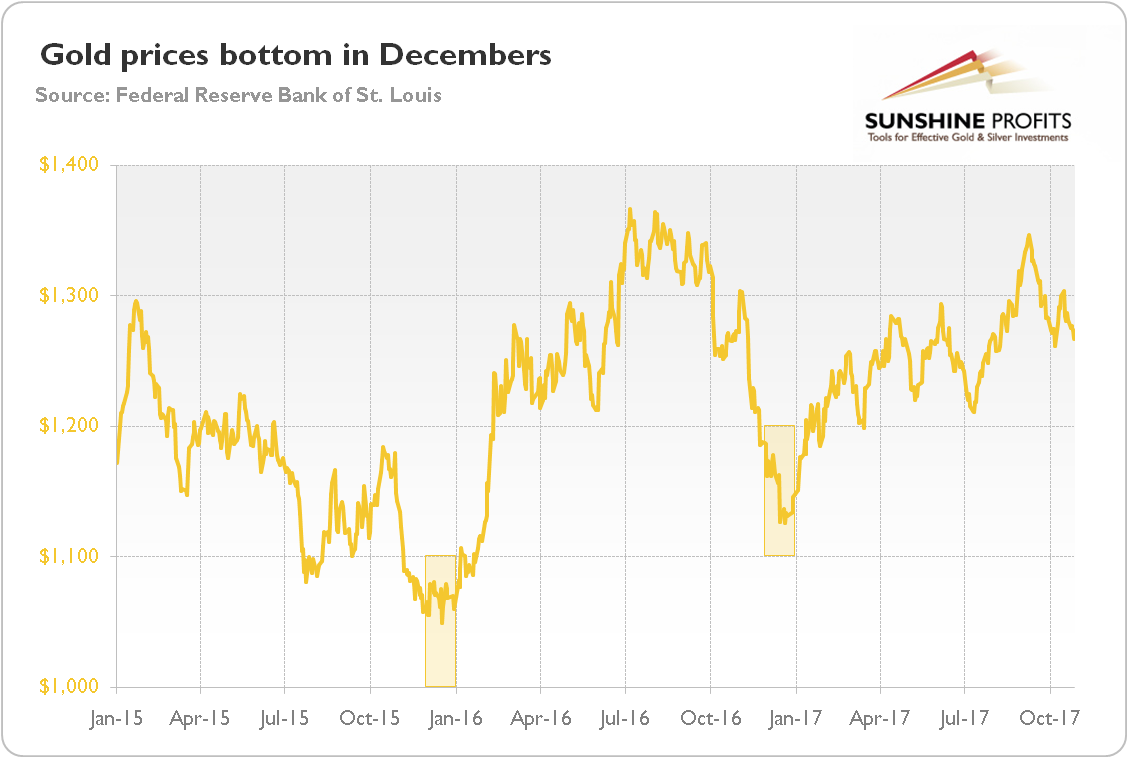
Will that pattern repeat itself this year? Well, there are some strong arguments in favor of that scenario. First, the price of gold actually started to decline in mid-October, in a similar fashion to 2015 and 2016.
Second, the previous lows occurred in December, as the Fed hiked interest rates in the final month of 2015 and 2016. As a reminder, the U.S. central bank is likely to raise rates in December 2017 as well. Actually, the market odds of such move are about 100 percent.
Third, there was a revival in the Trump’s trade, as the Senate passed a budget reconciliation bill in October, paving the way for tax reform. Such a rebound in investors’ expectations will support risky assets and hurt safe-haven assets such as gold.
Fourth, markets also expect that the FOMC will be more hawkish in 2018 than in 2017, due to the personal changes in the Board of Governors. Indeed, if the Senate approves Trump nominations, the new leadership at the Federal Reserve will be more hawkish than the Yellen-Fischer duo.
Fifth, the recent U.S. data was surprisingly positive. In particular, the GDP grew 3 percent in the third quarter of 2017, despite the negative impact of a few hurricanes. Actually, the current economic expansion is truly global – the IMF projects the world’s economy will grow 3.6 percent this year, the best result in a decade.
Sixth, the ECB meeting in October was more dovish than expected. Draghi adopted a less-but-longer approach, keeping a very accommodative stance. As we predicted in the September edition of the Market Overview, market expectations for the ECB’s pace of tightening were too elevated.
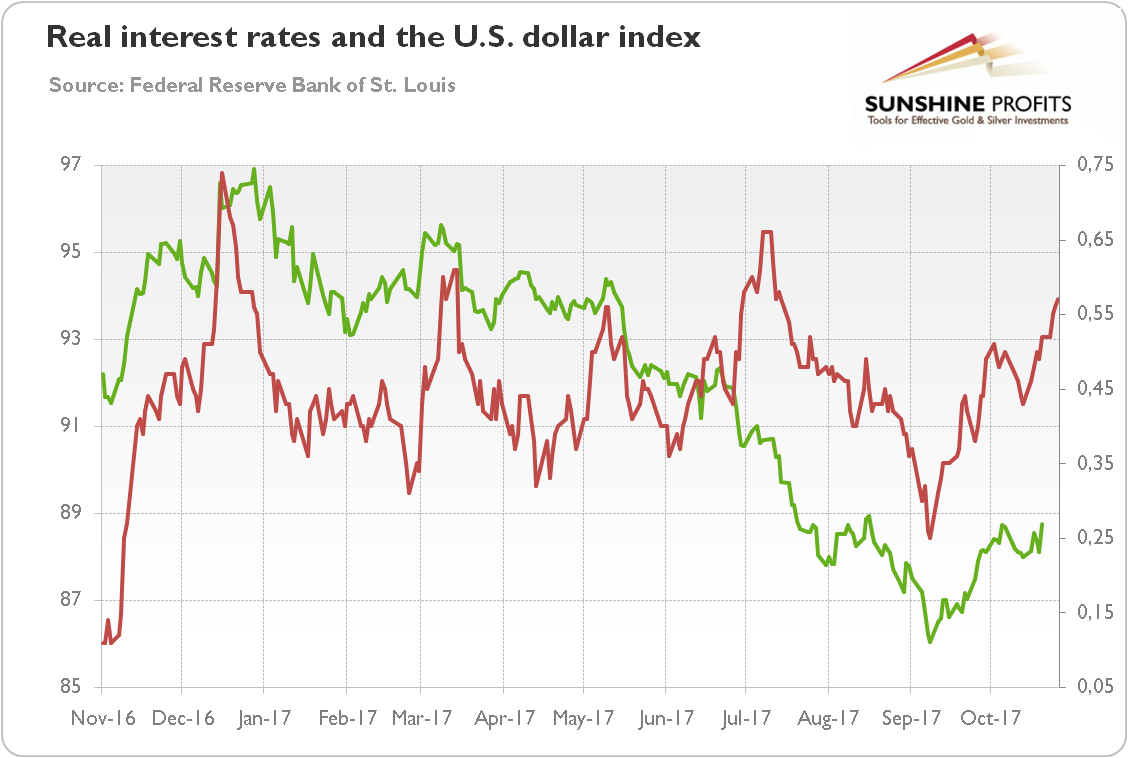
All of these factors are likely to support both the U.S. dollar and the U.S. real interest rates, which should add to downward pressure on the gold prices. As the next chart shows, the greenback and long-term real yield have been rising since mid-October (or, looking broadly, since September).
Chart 2: The U.S. real interest rates (red line, right axis, yields on 10-year Treasury Inflation-Indexed Security) and the U.S. dollar index (green line, left axis, Trade Weighted U.S. Dollar Index against Major Currencies) over the last twelve months.
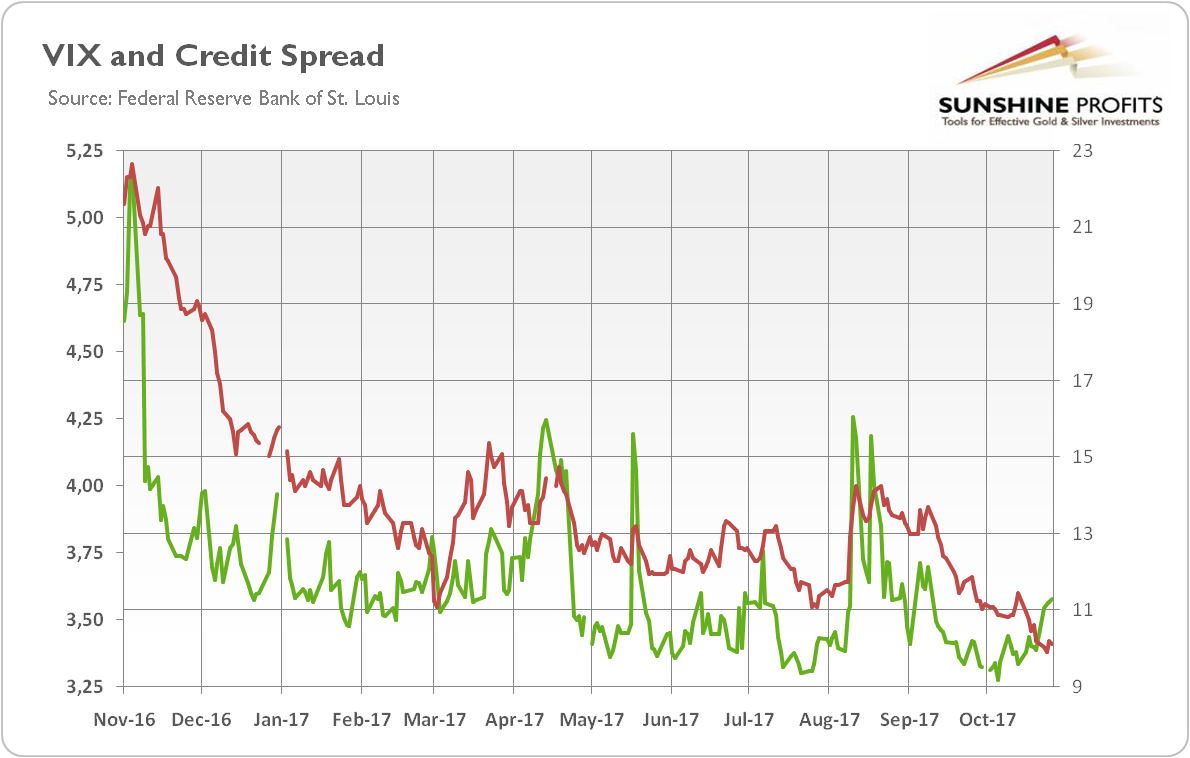
Seventh, the geopolitical risk seemed to ease somewhat in October. But, as one can see in the next chart, the CBOE Volatility Index has actually increased in the previous month. However, it remains at very low level (the rise resulted presumably from the conflict about Catalonia and speculations about the next Fed’s Chair), while the credit spreads declined further.
Chart 3: The market volatility reflected by the CBOE Volatility Index (green line, right axis) and the credit spread reflected by the BofA Merrill Lynch US High Yield-Option Adjusted Spread (red line, left axis) over the last twelve months.
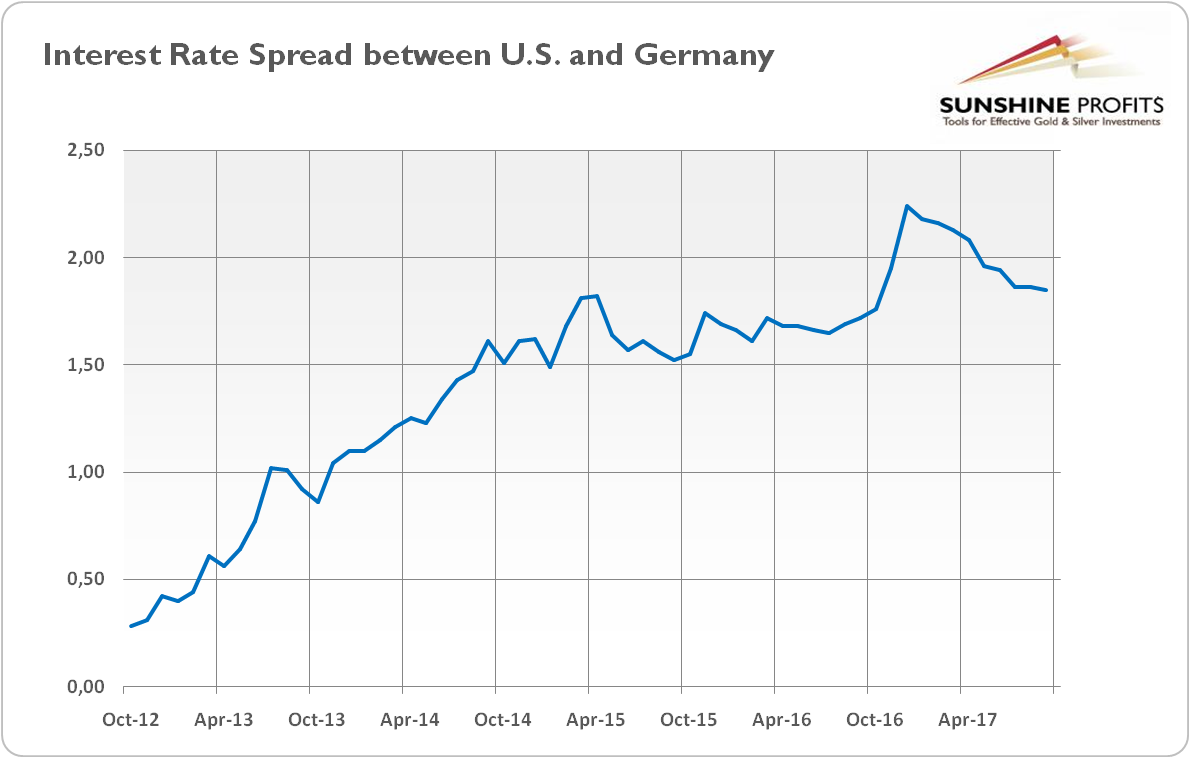
Given all these factors analyzed above, it is actually astonishing that the price of gold did not drop more. One of the possible explanations is the synchronized global growth we have already mentioned. Although gold does not shine during periods of decent economic growth and low inflation, the synchronization means that the U.S. economy is no longer the main engine of growth among advanced countries. Indeed, the long-term interest rate spread between the U.S. and Germany has been declining recently, as the next chart shows.
Chart 4: The difference between 10-year U.S. and German interest rates from October 2012 to September 2017.
The economic revival of the Eurozone – despite all of its structural problems – may cause the euro to continue its upward trend in the medium-term. Importantly, the emerging markets have been growing as well. Thus, the U.S. dollar may remain under pressure, which should be fundamentally positive for the gold prices.
Having said that, the macroeconomic outlook for gold deteriorated in October. The mix of accelerating growth and lack of inflationary pressure is negative for the yellow metal. And we would not be surprised if we see a temporary bottom in gold prices in December in analogy to what we saw in the last several years. The market odds of a December hike are at about 100 percent, so their increase is fully priced into gold, and the potential for further downside movement (at least, due to the expectations of the future Fed’s stance) is somewhat limited. Still, if the moves in the interest rates continue to be similar to the previous series of hikes, then the USD could finally start a bigger rally and that would mean trouble for gold.
If you enjoyed the above analysis, we invite you to check out our other services. We focus on fundamental analysis in our monthly more


