
Will The Market Bounce?
- SPX Monitoring purposes; Sold long SPX 9/7/18 at 2871.68=loss 1.03%: long 2901.52 on 8/31/18.
- Monitoring purposes Gold: Long GDX at 18.72 on 8/17/18
- Long-Term Trend SPX monitor purposes; Sold long-term SPX 7/16/18 at 2798.43= gain 2.95%; Long 6/29/18 at 2718.37.
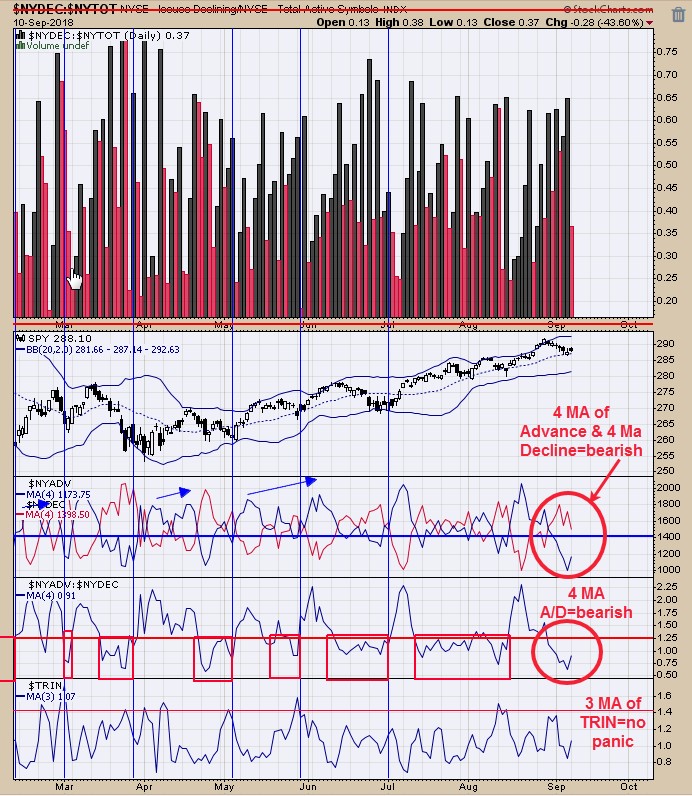
The bottom window is the “3 period moving average of the TRIN”. It is reading near 1.40. Today’s reading came in at 1.07 and that is not a reason for panic. The next window up is the Advance/Decline with a 4 period moving average. Readings above 1.25 are a bullish sign (today’s close .91). The next window up is the 4 MA of the advancing issues (blue line) and 4 MA of the declining issues (red line); when the blue line is higher than the red line than that is a bullish sign for the market and vice versa a bearish sign. The bearish sign is active now. The market can bounce here but probably will not go far. Could end up with a sell signal if the market does bounce.
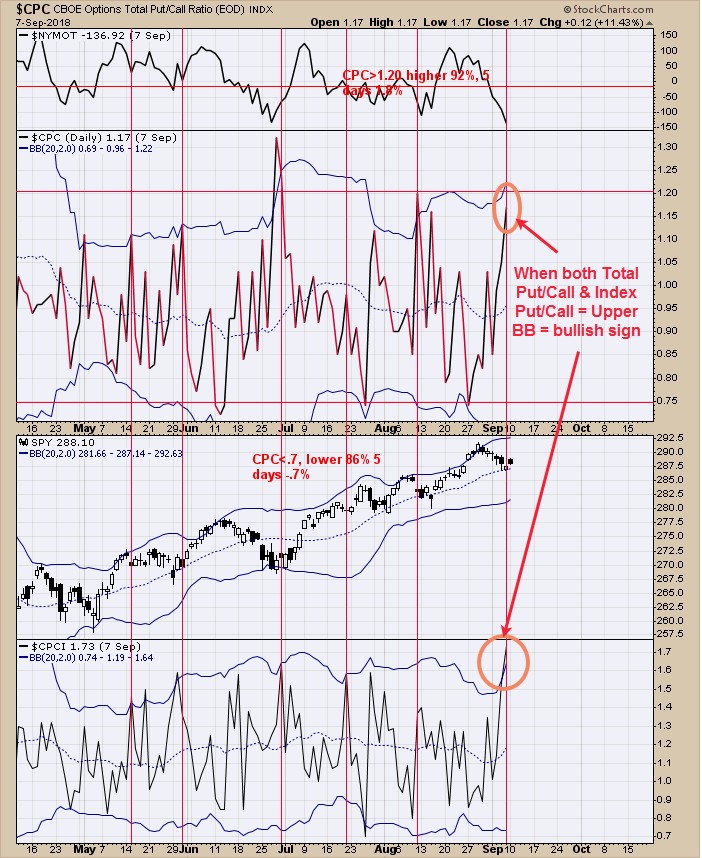
As far as the Put/Call ratios go, it's a bullish sign. At the bottom window is the Index Put/Call ratio which reached its upper Bollinger band and at the middle window is the Total Put/Call ratio which reached near its upper Bollinger Band.
When both put/call ratio reach or nearly reach its upper Bollinger band then the market has been near a short-term low (identified with red vertical lines). Not everything is rosy, the top window is the NYSE McClellan Oscillator which is below “0” closing near -140. Reading below “0” have been a bearish sign but its pretty oversold and does allow for a bounce. Also, the market has been down 6-days in a row and that has happened 12 times over the last 25 years. The market has been lower 10 of those times on average of 2.8% over the next 30 days. Therefore it would make sense if the market does bounce to look for a short position.
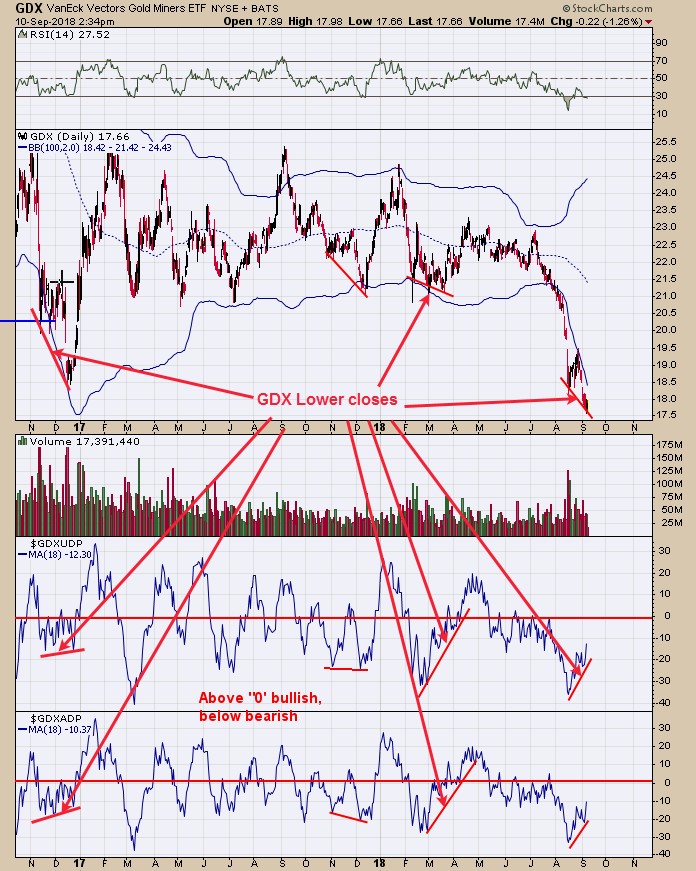
These are now short-term divergences. The bottom window is the 18 MA of the Advance/Decline and above that the 18 MA of the Up-Down Volume. Both indicators broke to new recent highs and made higher lows as GDX was making lower lows. We have pointed out in the past when this setup has occurred, the cumulative Advance/Decline and Cumulative up-down volume is also making higher lows.
These indicators suggest that a short-term low in GDX is near. The COT commercial report for gold published last Friday showed that gold commercials are not now net long 6525 contracts. Long GDX at 18.72 on 8/17/18.
Disclaimer: Signals are provided as general information only and are not investment recommendations. You are responsible for your own investment decisions. Past performance does not guarantee future ...
more

