
Will The Halloween Trick Turn Into A Holiday Treat?

The interest rate boogeyman came out in October as fears of an overzealous Federal Reserve monetary policy paralyzed investors into thinking rising interest rates could murder the economy into recession. But other ghostly issues frightened the stock market last month as well, including mid-term elections, heightening trade war tensions, a weakening Chinese economy, a fragile European economy (especially Italy), rising oil prices, weakening emerging market economies, anti-Semitism, politically motivated bomb threats, and anxiety over a potential recession after an aged economic expansion embarks on its 10th consecutive year of gains.
This ghoulish short-term backdrop resulted in the Dow Jones Industrial Average suffering a -5.1% drop last month, and the technology-heavy Nasdaq index screamed even lower by -9.2%. The results for the full year 2018 look more constructive – the S&P 500 is up +1.4% and the Nasdaq has climbed +5.8%.
Should the dreadful October result be surprising? Historically speaking, seasonality in the stock market has been quite scary during the month of October, especially if you consider the spooky stock Market Crash of 1929 (-19.7%), the 1987 Crash (-21.5%), and the bloody collapse during the October 2008 Financial Crisis (-16.8%). There is good news, however. Seasonally, the holiday months of November and December typically tend to treat investors more cheerfully during the so-called “Santa Claus Rally” period. Since 1950 through 2017, the average return for stocks during November has been +1.4% (45 up years and 23 down years). For December, the results are even better at +1.5% (51 up years and 17 down years).
| November (1950-2017) | December (1950-2017) | |||
| Up Years | Down Years | Up Years | Down Years | |
| 2017 2.40% | 2015 -0.02% | 2017 1.08% | 2015 -1.87% | |
| 2016 3.29% | 2011 -0.32% | 2016 1.76% | 2014 -0.33% | |
| 2014 2.45% | 2010 -0.44% | 2013 2.31% | 2007 -0.76% | |
| 2013 2.68% | 2008 -7.48% | 2012 0.70% | 2005 -0.10% | |
| 2012 0.28% | 2007 -4.18% | 2011 0.86% | 2002 -6.03% | |
| 2009 5.74% | 2000 -8.01% | 2010 5.99% | 1996 -2.15% | |
| 2006 1.66% | 1994 -3.93% | 2009 1.48% | 1986 -2.83% | |
| 2005 3.52% | 1993 -1.29% | 2008 1.65% | 1983 -0.87% | |
| 2004 3.86% | 1991 -4.39% | 2006 1.26% | 1981 -3.01% | |
| 2003 0.71% | 1988 -1.89% | 2004 3.25% | 1980 -3.39% | |
| 2002 5.71% | 1987 -8.51% | 2003 5.08% | 1975 -1.15% | |
| 2001 7.52% | 1984 -1.51% | 2001 0.76% | 1974 -1.78% | |
| 1999 1.92% | 1976 -0.78% | 2000 0.41% | 1969 -1.87% | |
| 1998 5.91% | 1974 -5.32% | 1999 5.78% | 1968 -4.16% | |
| 1997 4.46% | 1973 -11.39% | 1998 5.64% | 1966 -0.15% | |
| 1996 7.34% | 1971 -0.25% | 1997 1.57% | 1961 -0.32% | |
| 1995 4.10% | 1969 -3.41% | 1995 1.74% | 1957 -3.31% | |
| 1992 3.03% | 1965 -0.88% | 1994 1.26% | ||
| 1990 6.00% | 1964 -0.52% | 1993 0.98% | ||
| 1989 1.65% | 1963 -1.05% | 1992 1.01% | ||
| 1986 2.15% | 1956 -3.10% | 1991 11.19% | ||
| 1985 6.51% | 1951 -0.95% | 1990 2.48% | ||
| 1983 1.74% | 1950 -0.26% | 1989 2.14% | ||
| 1982 3.60% | 1988 1.48% | |||
| 1981 3.27% | 1987 7.28% | |||
| 1980 10.24% | 1985 4.51% | |||
| 1979 4.26% | 1984 2.24% | |||
| 1978 0.61% | 1982 1.50% | |||
| 1977 2.86% | 1979 1.68% | |||
| 1975 2.47% | 1978 1.16% | |||
| 1972 4.56% | 1977 0.28% | |||
| 1970 4.74% | 1976 5.25% | |||
| 1968 4.80% | 1973 1.79% | |||
| 1967 0.75% | 1972 1.18% | |||
| 1966 0.31% | 1971 8.62% | |||
| 1962 10.16% | 1970 5.68% | |||
| 1961 3.77% | 1967 2.63% | |||
| 1960 2.97% | 1965 0.90% | |||
| 1959 1.52% | 1964 0.39% | |||
| 1958 1.78% | 1963 2.44% | |||
| 1957 3.17% | 1962 1.35% | |||
| 1955 7.64% | 1960 5.08% | |||
| 1954 7.71% | 1959 2.03% | |||
| 1953 0.41% | 1958 4.78% | |||
| 1952 4.31% | 1956 1.50% | |||
| 1955 0.29% | ||||
| 1954 5.85% | ||||
| 1953 0.12% | ||||
| 1952 3.47% | ||||
| 1951 3.62% | ||||
| 1950 3.81% | ||||
While the last 31 days may have been distressing, at Sidoxia we understand that terrifying short-term volatility is a necessary requirement for long-term investors, if you desire the sweet appreciation of long-term gains. Fortunately, at Sidoxia our long-term investors have benefited quite handsomely over the last 10 years from our half-glass-full perspective. The name Sidoxia actually is derived from the Greek word for “optimism” (aisiodoxia).
Performance has been fruitful in recent years, but the almost decade-long bull market has not been all smooth sailing (see Series of Unfortunate Events), as you can see from the undulating 10-year chart below (2008-2018). Do you remember the Flash Crash, Debt Ceiling, Greek Crisis, Arab Spring, Crimea, Ebola, Sequestration, and Taper Tantrum, among many other events? Similar to the volatility experienced in recent weeks, all these aforementioned events caused scary downdrafts as well.
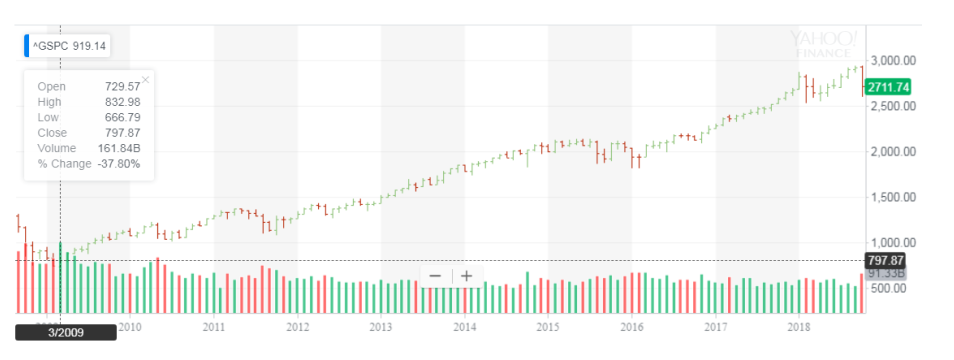
The S&P 500 hit a low of 666 in March 2009, but even with the significant fall last month, the stock market has more than quadrupled in value to 2,711 today.
The compounding benefits of long-term investing are quite evident over the last decade when you consider the record profits of the stock market. Compounding benefits apply to individual stocks as well, and Sidoxia and its clients have experienced this first hand through ownership in positions in stocks like Amazon.com Inc. (+2,692% in 10 years), Apple Inc. (+1,324%), and Google (parent Alphabet) (+507%), and many other less-familiar growth companies have allowed our client portfolios and hedge fund to outperform their benchmarks over longer periods of time. Although we are proud of our long-term performance, we have definitely had periods of underperformance, and there will come a time in which a more defensive stance will be required. However, panicking is very rarely the best course of action when you are talking about your long-term investment strategy. Staying the course is paramount.
During periods of heightened volatility, like we experienced in October, the importance of owning a broadly diversified portfolio across asset classes (including stocks, bonds, real estate, commodities, emerging markets, growth, value, etc.) is worth noting. Of course, an asset allocation should be followed according to a risk tolerance appropriate for your unique circumstances. As financial markets and interest rates gyrate, investors should get in the practice of rebalancing portfolios. For example, at Sidoxia, we are consistently harvesting our gains and opportunistically redeploying those proceeds into unloved areas in which we see better long-term appreciation opportunities. This whole investment process is designed for reducing risk and maximizing returns.
As in some famously scary stock market periods in the past, October turned out to be another frightening month for investors. The good news is that we have seen this scary movie many times in the past, and we have lived to tell the tale. The economy remains strong, corporate profits are at record levels and still rising, consumer and business confidence levels are near all-time highs, and interest rates remain historically low despite the Fed’s gradual interest rate hiking policy. While Halloween has definitely worried many investors, history tells us that previous tricks may turn into holiday treats!
Disclosure:
Sidoxia Capital Management (SCM) and some of its clients hold positions in certain exchange traded funds (ETFs), but at the time of publishing had no direct position in TSLA ...
more


Not in one night it won't. We were expecting a pump for a week or so anyway before it retest previous Lowe's of October. Ploy