
Will The Bounce Have Legs? – Weekly Market Outlook
Although the market technically lost ground last week, between Wednesday's and Thursday's back-to-back intraday reversal bars and Friday's strong bullish follow-through, stocks ended the week on such a positive note that it's tough not to be at least a little bullish now. And, given that all big trends start out as small ones, Friday's bullish seed may well be the beginning of a 'normal' year-end rally.
There are still a couple of potential tripwires in front of us, but traders may already be preparing a way around or over them — until they reach potential overhead resistance. We'll discuss those potential pitfalls in a moment, after a look at last week's and this week's major economic news.
Economic Data
Last week's economic dance-card was plenty full last week, though three data sets are clearly more important than the rest… retail sales, industrial productivity (and capacity utilization), and housing starts (with building permits). We'll focus our discussion to just those three items, beginning with September's retail sales released on Wednesday.
Although the retail sales numbers given to us by the Department of Commerce were negative, it's important to understand that the results are a comparison to August's levels; there may well be a calendar-based reason for the slight dip that shouldn't be a concern. In any case, retail sales fell by 0.3% last month, and when taking automobiles out of the calculation, they still fell by 0.2%. As the chart below (of absolute retail spending) below shows, however, the broad trend of US retail sales is still pointed in an upward direction…. firmly.
Retail Sales Chart
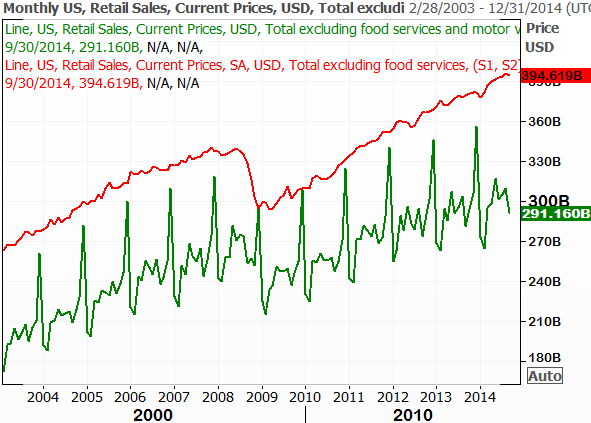
Source: Thomson Reuters Eikon
On Thursday the Federal Reserve gave us its measure of industrial activity. Production was up 1.0% last month, and technically speaking has never been stronger. Meanwhile, utilization of the nation's industrial output capacity stands at 79.3%. That's tied for as high as it's been in years. Both trends bode well for the long-term market — we've discussed previously that there is a correlation between these two economic measures and the stock market.
Capacity Utilization and Industrial Production Chart
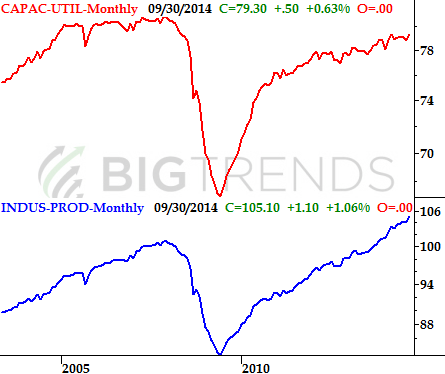
Source: Federal Reserve
Last but not least, the pace of housing starts and building permits grew respectably last month. The pace of new starts jumped to 1.017 million, while building permits were issued at a pace of 1.018 million in September. Both pieces of data continue to show modest progress for the real estate and construction market.
Housing Starts and Building Permits Chart
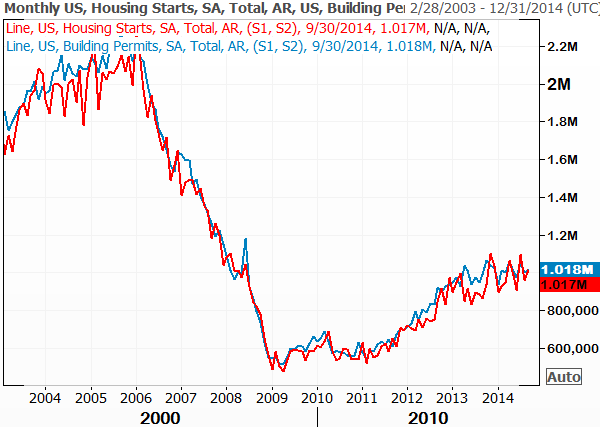
Source: Thomson Reuters Eikon
Everything else is on the following grid. Notice we'll get a great deal more real estate data this week to round out last week's information.
Economic Calendar
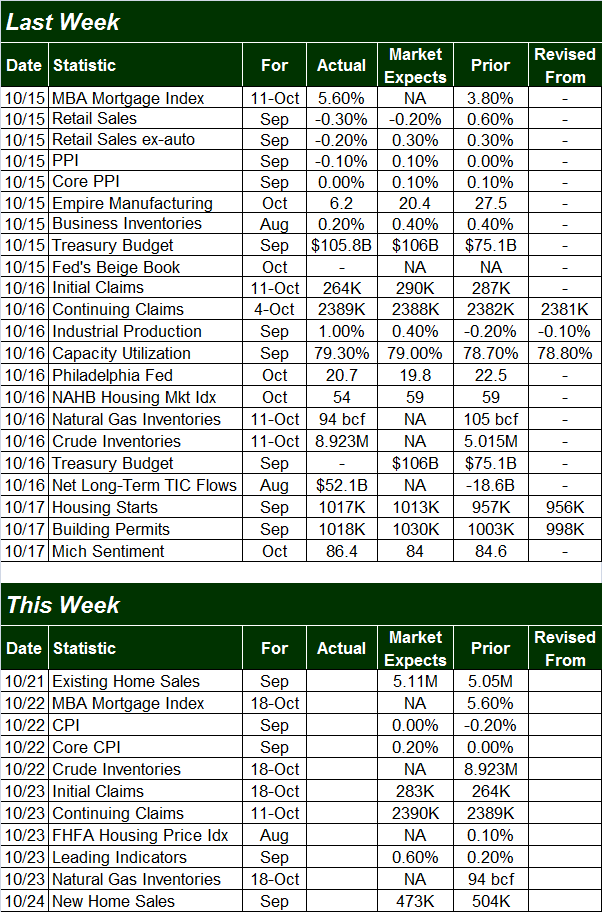
Source: Briefing.com
As was noted, there's a great deal more real estate data on the way this week, including measures of home sales and home prices. While these numbers will be detailed on next week's outlook, our chart puts the trends for those data sets in perspective heading into the release of these numbers. Notice that, although not as brisk as they were a year ago, all these trends continue to broadly move in a positive direction.
Real Estate Data Trends Chart
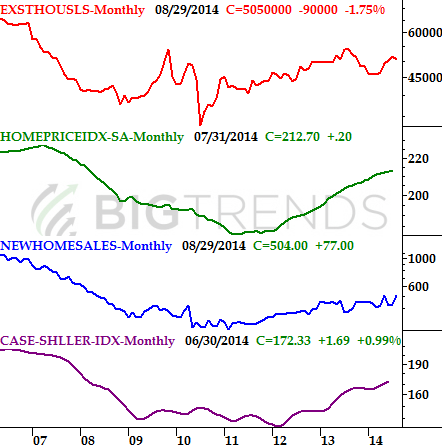
Source: Standard & Poors, National Assn. of Realtors, and FHFA
The other item of significant interest this week (other than the wide variety of corporate earnings reports on tap) is the inflation figure for September, due on Tuesday. We got the producer price inflation number last week; it stood at an annualized pace of 1.6%… the lowest reading since March. August's consumer price inflation reading was 1.7%, and had fallen for three straight months. It will be interesting to see if this trend can be halted before deflation becomes a legitimate threat.
Inflation Trends Chart
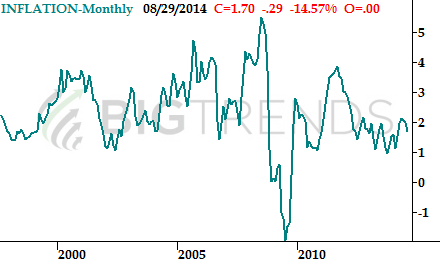
Source: Bureau of Labor Statistics
Stock Market Index Analysis
While the market may have finished last week on a high note, there are still a couple of cards the bears could play to halt the rebound before it got any more traction. And, it wouldn't be a complete shock if it did. Let's start with the NASDAQ Composite (COMP) (QQQ) this week to put things in their right, complete perspective first.
Yes, the NASDAQ made a healthy reversal effort between Wednesday and Friday. However, the rally on Friday suspiciously stopped at the key 200-day moving average line (green) before fading back to the middle of the day's low-to-high trading range. Throw in the fact that the Nasdaq Volatility Index (VXN) (VXX) left behind a gap with its sharp drop on Friday [not to mention the modest volume behind the gains], and what you have is at least a little bearish pressure on stocks. It's a problem, however, because a small drop could easily be misinterpreted as the beginning of a large drop by still-nervous investors.
NASDAQ Composite & VXN – Daily Chart
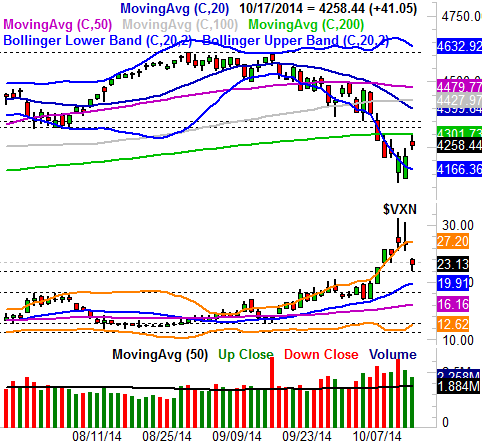
All charts created with TradeStation
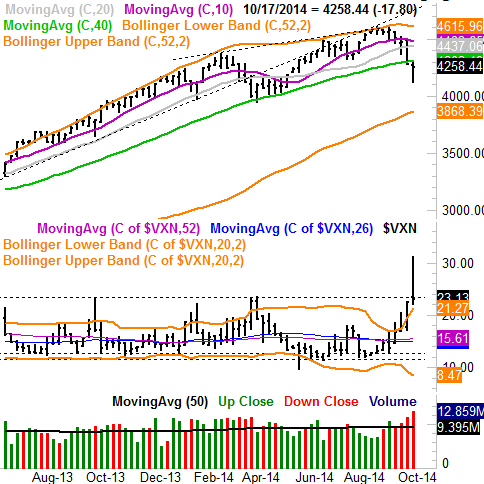
The weekly chart of the NASDAQ doesn't show us anything new, but it does confirm the composite and the VXN are both working on reversals. The big problem looks even bigger in this timeframe, though…. the NASDAQ Composite is under the 200-day moving average line for the first time in a long time.
NASDAQ Composite & VXN – Weekly Chart
The daily chart of the S&P 500 (SPX) (SPY) doesn't tell us anything new; we're still below the 200-day moving average line in this chart too, for now. It's at 1906, which is already a key level in that the 1906 level was a major floor in early August.
S&P 500 & VIX – Daily Chart
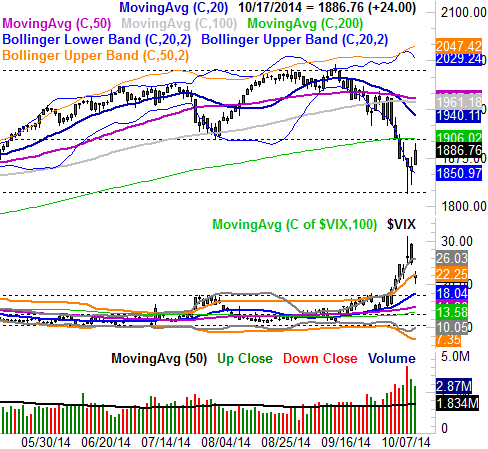
Bottom line: The severity of the spikes from the volatility indices and the depth of the plunges from the stock indices were all probably significant enough to keep the bounce in motion for several more days, which should carry all the stock indices above their near-term ceilings. But be careful here, however. Investor confidence is still pretty shaky, and it may not take much to rekindle the selling here in the shadow of what's been a 9.8% correction so far. A move above the near-term resistance would go miles in the repair of that confidence. Until that happens though, caution is still the smart move.
And on a side note, there's still a pretty thick swath of resistance above the 200-day moving average lines. The NASDAQ's and the S&P 500's 50-day and 100-day moving average lines are converging now, and those lines should be tough ceilings on their respective charts… if tested. Also watch for any performance divergences among these various broad market indices, including the Russell 2000 (RUT) (IWM) and Dow Jones Industrial Average (INDU) (DIA) — there's been a bit more of this recently than we've seen in a while.
While it's the lower-odds outcome here, a move below last week's lows could – and probably would – spark another sizeable round of selling. Such a selloff doesn't align with the usual seasonal bullishness this time of year, but it can't be ruled out. Another scenario in this current volatile environment is a rapid rebound in the market that takes out the potential overhead resistance going into year-end.
Almost needless to say, this week is a pivotal one for the market.
Trade Well,
Price Headley
None.


