
Will Small-Caps Pull Large-Caps Higher Or Will High-Yield Drag Small-Caps Lower?
US small-caps are outperforming. Price action is great. But large-caps are not on the same page. And high-yield corporate bonds have diverged with small-caps for a while now.
In early 2016 when US stocks reached a major low, several other asset classes were in agreement. Not to mention macro data.
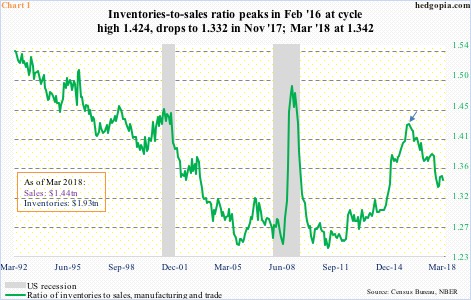
The ratio of inventories to sales in US manufacturing and trade reached a cycle high 1.424 in February that year, before coming under sustained pressure. The ratio then proceeded to drop to 1.332 last November (Chart 1), with March this year at 1.342.
Sales picked up momentum, even as accumulated inventories got depleted. From February 2016 to March this year, sales rose 13.8 percent to a seasonally adjusted annual rate of $1.44 trillion, and inventories 7.2 percent to $1.93 trillion. This gave a sustained push to economic activity.
Along the same lines, the ISM manufacturing index bottomed at 47.8 in January 2016. It went on to rise to 60.8 this February, which was the highest since May 2004. (April was down two points month-over-month to 57.3.)
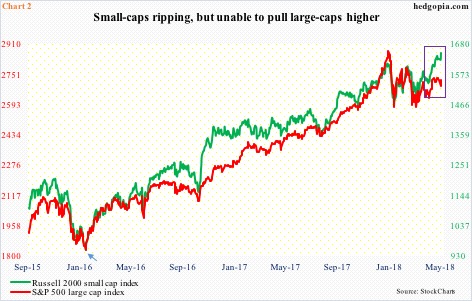
Both small- and large-cap stocks bottomed in February 2016 (arrow in Chart 2). Ditto with spot West Texas Intermediate crude, which, after peaking at $107.68/barrel in June 2014, dropped all the way to $26.05 in February 2016. Last week, it reached a multi-year high $72.90.
Corporate earnings were the same way.
After peaking in 4Q14 at a seasonally adjusted annual rate of $2.23 trillion, US corporate profits adjusted for inventory and capital consumption bottomed at $1.98 trillion in 4Q15, reaching $2.2 trillion in 1Q18.
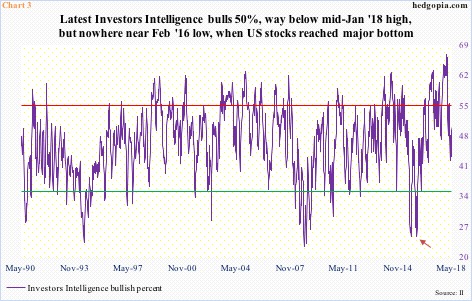
Investor sentiment followed along. In the week ended February 9, 2016, Investors Intelligence bulls were 24.7 percent (arrow in Chart 3). Matching the low of September 2015, this was the lowest since 23.1 percent in December 2008. Once the suppressed bullish sentiment unwound, this turned into a major tailwind for stocks.
In fact, in the subsequent weeks and months, bulls rose all the way to 66.7 percent, which was hit in the middle of January this year, just before the bottom fell out of US equities.
This week, bulls rose nine-tenths of a percentage point week-over-week to 50 percent – a 10-week high. Bears were 19.2 percent, versus 39.2 percent in February 2016.
If all this suggests anything, it is that the reversal low of this February is not a major low. Be it macro data, investor sentiment, or what have you, there just is not enough fuel left to sustainably provide a tailwind for stocks.
What then are we to make of small-cap outperformance in recent weeks? Major US equity indices peaked late January and bottomed early February. After this, the Russell 2000 small-cap index is the only one to break out to a new high. In fact, bids consistently showed up as breakout retest occurred last week and this Tuesday. Wednesday, it shot up 1.5 percent.
This is coming at a time when earnings revision trend has been nothing to write home about.
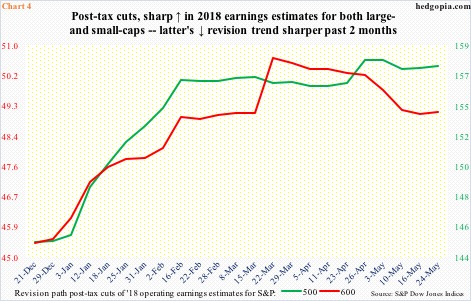
Chart 4 plots 2018 operating earnings estimates for both S&P 500 and 600 companies beginning December 21 last year. The Tax Cuts and Jobs Act of 2017 was signed into law on December 22, hence the spike in estimates on the left side of the chart.
The latest data point is as of last Thursday – $157.23 for the 500 and $49.14 for the 600. Estimates for the 500 peaked early May at $157.65, but much earlier for the 600. In the week ended March 22, S&P 600 companies were expected to bring in $50.66. The revision trend for the 600 has been sharper.
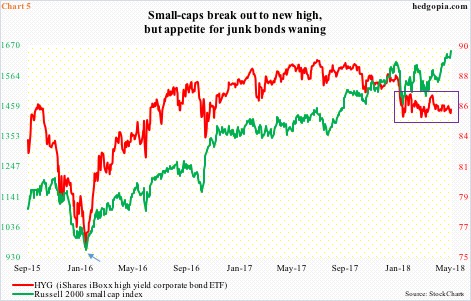
Equity bulls obviously hope that large caps, substantially diverging thus far (box in Chart 2), eventually move in tandem with their small-cap brethren. But it is not that simple. The bears can as easily point to Chart 5, which pits the Russell 2000 against a high-yield corporate bond.
Once again, back in February 2016 both the Russell 2000 and HYG (iShares iBoxx high yield corporate bond ETF) bottomed at the same time (arrow in Chart 5), but have diverged for the last several months, particularly shortly after bottoming early February this year (box in Chart 5). Risk appetite for junk bonds has been waning.
This will resolve one way or the other. The price action on small-caps is bullish, but several other metrics failing to confirm the move is not. Unlike February 2016, signals are mixed at best.
Disclaimer: This article is not intended to be, nor shall it be construed as, investment advice. Neither the information nor any opinion expressed here constitutes an offer to buy or sell any ...
more

