Why You Can’t Afford To Miss European Small Caps
After getting past a variety of elections—most notably the French presidential election—without anti-market sentiment spreading throughout Europe, we have seen a relatively large shift in equity market performance. Fundamentals within Europe were allowed to drive performance as opposed to equity markets needing to be wary of Brexit or Trump-like election surprises.
Europe’s fundamentals and, particularly, rebounding earnings have been strong.1
Small-Cap Stocks Can Respond Quickly to Strong Economic/Fundamental Data
In Europe, we’ve seen the cyclical nature of small caps—and it happens to be connected to a distinct outperformance over European large caps over the longer term.
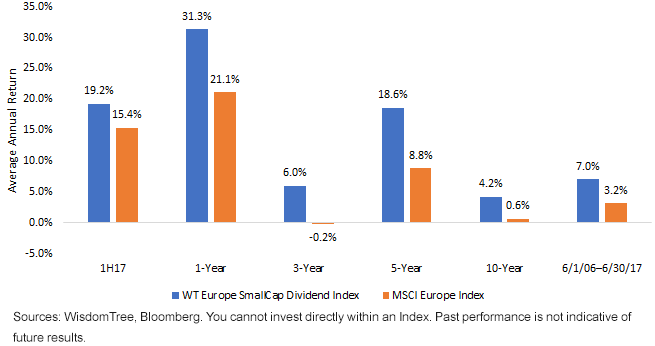
European Small Caps—Both Short- and Long-Term Track Record Looks Strong
(Click on image to enlarge)

Characteristics of the WisdomTree Europe SmallCap Dividend Index today:
- Revenue: First, it’s notable that over 70% of weighted average revenue comes from inside of Europe.2 Investors who are excited about European equities today are largely excited by what is happening within Europe, and small caps tend to be a purer play on this theme, as opposed to large-cap multinationals.
- Cyclical Exposures: Second, it’s notable that more than 83% of the weight of the WisdomTree Europe SmallCap Dividend Index is in cyclical sectors.3 This gives the Index a very offense-oriented positioning, and when positive catalysts (such as election results) come in, there tends to be a greater potential to respond.
- Track Record: Finally, we see the over-19%return for the first half of the year and the over-30% one-year return coupled with a strong longer-term track record. The WisdomTree Europe SmallCap Dividend Index has been live since June 1, 2006, which gives investors more than 11 years to consider when performing any analysis. Outperformance of European large caps has been frequent.
Is Adding European Small Caps to European Equity Exposures Additive?
Across many of the clients that we speak with, there has been a notable trend in behavior. U.S. equity exposures tend to be very stratified in that there may be sector-specific strategies, style-specific strategies, factor strategies and size-segment-specific strategies. In short, there are myriad ways in which the performance of U.S. equities tends to be accessed.
Beyond the U.S. borders, the list narrows. There is nowhere near the same appetite for stratification, and for many clients that we speak with, the concept of incorporating a small-cap strategy is something entirely new.
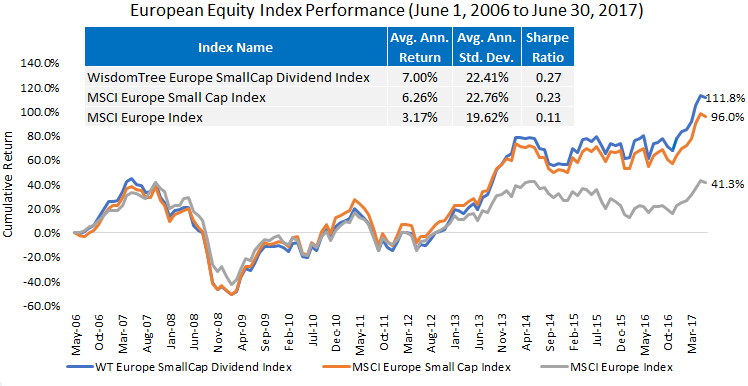
European Small Caps Have Distinctly Outperformed since June 1, 2006, & Rolling Period Sharpe Ratio Analysis also Looks Strong
(Click on image to enlarge)

(Click on image to enlarge)

- Small Caps Can Steer around More Global Concerns: We can see clearly that there was a divergence around May 2013. Both the WisdomTree Europe SmallCap Dividend Index and the MSCI Europe Small Cap Index opened up significant outperformance over the MSCI Europe Index. As concerns about European banks and energy firms have occurred at times between May 2013 and June 2017, it’s important to remember that in most cases these are huge companies. In market capitalization-weighted approaches that put the largest weights in the biggest companies, these would have been important exposures, very influential on performance. Small-cap strategies simply did not include them.
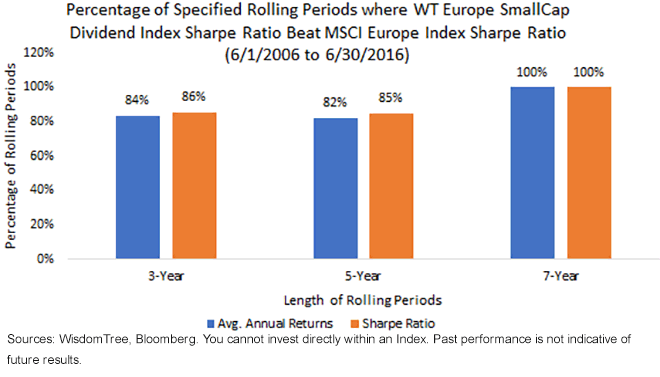
- We additionally looked at rolling subperiods of three, five and seven years. Now, our prior chart indicates a track record of outperformance, but it is really just one period of slightly more than 11 years. What about different subperiods of three, five or seven years? While on a rolling seven-year basis the WisdomTree Europe SmallCap Dividend Index both outperforms and has a higher Sharpe ratio in 100% of periods observed, both the three- and five-year rolling period analysis gives the nod to the WisdomTree strategy a bit more than 80% of the time when compared to the MSCI Europe Index.
Disciplined Rebalance Process
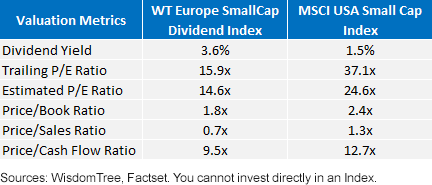
While the strong gains witnessed above might lead the contrarian to think, Won’t these gains just be reversed if they have come too far? Every June, WisdomTree conducts an annual rebalance that is designed to manage market valuation risk and reduce exposures to stocks that have appreciated more than underlying fundamentals—and, in our case, this is measured by changes in dividend streams. This leads to the WisdomTree European SmallCap Dividend Index to have a dividend yield greater than 3.5%, a P/E ratio around 15 to 16x and a price-to-cash flow of less than 10x. If we compare this to U.S. small caps (MSCI USA Small Cap Index), we see a relatively attractive picture—especially if the European economy is about five years behind the U.S., as our European economic team believes. Importantly, one reason why the P/E ratio of the MSCI USA Small Cap Index is that much higher on a trailing 12-month basis is because approximately 15% of the weight of the index consists of firms with negative trailing 12-month earnings per share—a figure that is only about 3% for the WisdomTree Europe SmallCap Dividend Index.
Valuations Point to Potential Opportunity in Europe over the U.S.
(Click on image to enlarge)

1Source: Bloomberg, with data as of 6/30/17.
2Sources: WisdomTree, FactSet, with data as of 5/31/17.
3Sources: WisdomTree, Bloomberg, with data as of 6/30/17.
Disclaimer: Investors should carefully consider the investment objectives, risks, charges and expenses of the Funds before investing. U.S. investors only: To obtain a prospectus containing this ...
more


