
Why We Still Desperately Need The Pickens Plan
In my last article on oil, I discussed the unpredictable mess oil pricing is in. I gave several reasons, but I'd like to focus on just one here - probably the most important one. I alluded to it in the discussion of conventional oil vs shale, describing a CNBC interview with Boone Pickens. As a primer to this discussion, I suggest you look at that article. But to recap, after some contentious wrangling with Joe Kernen over the "horrible call" of the peak oilers, Pickens responded: "You need to go back and look at what happened to oil production without the United States." Kernen then goes on about the Malthusian bet on world catastrophe. Pickens answers, "Yeah, well that's all good bullshit and all [this cracks Kernen up] ...in 2005, you peaked. Go back and look at it ... I'm the expert, not you ...what saved you was the shale." The conversation meanders from there with Kernen complaining that "oil is oil", not understanding much about the oil business. Shale is as if we traveled to a whole new planet and began farming it and adding it to our earth oil that we've been poking a holes in underground balloons for.
There is such a vast difference, especially in the math of net energy; and it explains why industry sages like Pickens tend to view the 2005 conventional peak as the only one that really matters. The difference is critical, because if anything happens to shale, we're back on Hubbert's curve and in a severe energy shortage.
So what is this big problem with the "math" of net energy I referred to? This is the ratio of the energy recovered to energy spent to find and recover it. In the very early days, when Jed Clampett found a reservoir on his land out shootin' for some food, this ratio was better than 15,000 to 1 (the cost of the rifle bullet). Then, after the easy finds were exploited and oil had become a big industry, this ratio was around 40 to 1, and as the cherry picked fields depleted, it has become about 10-15 to 1 now. For shale drilling, the net energy ratio is vastly different, only around 3-4 per the 2010 study by ETSAP, a branch of the IEA. Others estimate it at 5. But this is all a very precarious net energy range for something that is being relied upon to replace the energy from conventional reservoirs.
Why is an EROI (Energy Return On Investment) of 3-5 so critical? Let me demonstrate graphically:
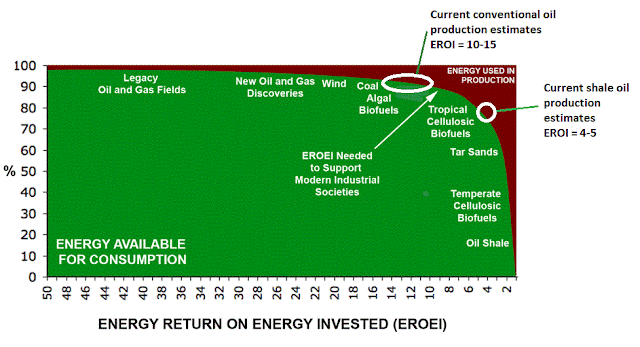
This is a net energy cliff chart, and if you've never looked at one, prepare to be scared. It simply shows the energy that is available to the economy after all the energy used to produce the energy is totaled and subtracted. For all of our oil age, we've enjoyed an EROI of 100 initially to about 10 today - with conventional. As you can see on the chart, this meant that over 90% of the recovered barrels were fueling economic growth. Since we started adding biodiesel, tar sand, shale oil (akin to tar sand), and corn ethanol, we've been building our barrel count with things on the diving end of the graph - all with EROI of 4 or less. All oil EROI deteriorates over time. Our hero fracked shale oil, is perched at the very edge of the cliff preparing for its dive. This ain't the Olympics and it's not a good thing.
For the 150 years of the oil age, this graph didn't matter, but we are entering the problem zone now. For example, an abstract from a 2013 study "The implications of the declining energy return on investment of oil production" makes the same statement graphically shown above:
as EROI declines below 10, a point is reached when the relation between EROI and price becomes highly nonlinear
"Highly nonlinear" means the sharp curve into the ditch shown. But we have all these barrels at all time high counts, way up from the peak oil craze 10 years ago, don't we? Well, yes, but it's not the number of barrels, it's the net energy from them that matters. More and more massive amounts of those barrels are being sent back to the energy production arenas and away from the economy.
This is suggested by the following chart that I calculated back in 2008 on barrel count vs net energy. It was an energy balance projection with the scheduled new production coming online and the typical net energy ratios acting on all the different types of oil:
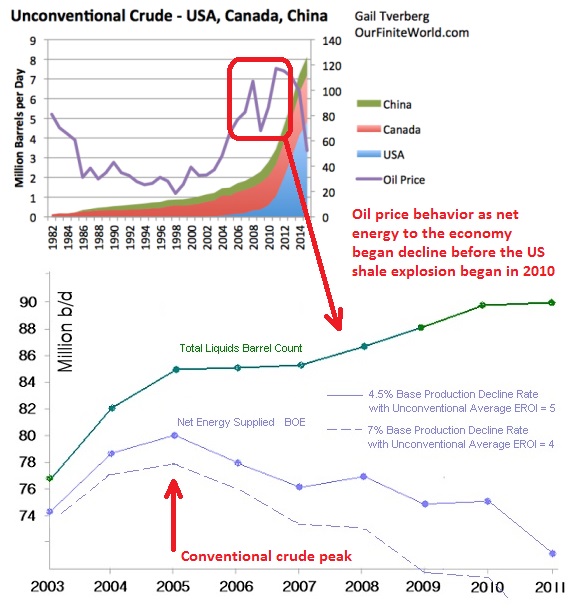
Here we see just how badly net energy to the economy suffered, per this projection, when conventional oil went past its 2005 peak. Demand kept climbing, and barrel counts also kept climbing nicely to match it. However, until the US shale explosion caught fire in 2010, it was mainly the Canadian tar sand and equivalent (red area in the Tverberg chart) filling all the extra barrels with its EROI of 1.5 to 3 - and it did very little to prevent the price of oil in the smoothed curve shown from careening to a new all time high in 2011. Yes, the average price shot even higher than in the brief, aberrant, speculation induced spasm of 2008, involving the well known $147 figure. The climbing barrel count in 2011 didn't seem to matter to this apparent oil shortage. It was not a barrel count shortage, it was an energy shortage.
It wasn't until the US shale explosion came along in force in 2010, (blue area in the Tverberg chart)with an EROI of about 5, at the very top of the net energy cliff (US) instead of at the bottom (Canada) that the oil price was sent crashing. If you study this tell tale energy chart closely, you see that it is net energy, not barrel count that is now pulling the strings on oil prices.
In the preceding decades, barrel count was essentially the same as energy count - energy to the economy that is. It was all from conventional. But now this developing divergence between barrel count (what all the world cares about) and net energy being supplied to our economy is becoming a little understood but massive problem. Scientists and oil people like Pickens appreciate this, but hardly anyone else does. Certainly not our main media reporters or our energy planners.
Chemists Without Borders did a study of our non-recovery of the real economy as it relates to oil's net energy. Since the steady climb going into 2008, the oil price has been in a volatile range:
These upper and lower oil price bounds have characterized the bumpy plateau of oil production that we have been on since 2005, and go along way explaining our protracted economic non-recovery from the financial crash of 2008. Some analysts think that this indicates we’ve hit peak oil, and also that it signals the end of the era of economic growth (e.g. Heinberg, 2011) – that we are not in a "recession" per se, because "recession" implies a defined trough ending with an uptrend back to "normal," but are experiencing the first symptoms of economic stall and contraction
I personally think that bungling anti-business policies of governments, and a flawed monetary age coming to its end are the proximate cause for our no-growth age. They are trying to do with surplus money what surplus energy has always done. I like what Tim Morgan, author of Life After Growth says about this as relayed in a forbes.com piece "Why Shale Oil Boosters Are Charlatans In Disguise":
Morgan makes a key distinction between what he terms the money economy and the real economy. He suggests economists around the world have got it all wrong by focusing on money as the key driver of economies. Instead, money is the language rather than the substance of the real economy. The real economy is a surplus energy equation, not a monetary one...
The investing implications of this net energy problem is perhaps a lesser dependence on the classic cyclical plays. We're doing away with the normal economic cycles. There is no big cycle to play anymore. Also, if shale oil runs into any kind of post sweet spot deterioration of its precarious EROI of 4 or 5 down to say 2 or 3 (see cliff chart above) its huge boost to our net energy supply, saving us from $100 plus oil prices, will be over no matter what barrel count the fracking produces. A summation of net energy at Chemistry World notes, "... in the US, it is the sweet spots that have been drilled, and the shale plays elsewhere across the continent are likely to prove less productive". Barring the economic dangers, oil will climb in sharp unison with any EROI decline in the shale plays as we fall off the net energy cliff.
Shale's future net energy profile is a mystery. But geologists have had over 50 years to thoroughly scout the shale basins. They knew a lot about them clear back in the 1950s, and they were even discussed in Hubbert's 1956 work projecting peak US oil. Hubbert worked with only conventional oil, however. Oil company geologists are very good about knowing where to drill first. Far different than conventional oil, the typical shale well depletes by about 80% in the first two years. So you have to wonder what kind of net energy to expect after the first few rounds of plays are gone. I plan on doing an article looking at what's really out there in dreg oil. It will support Boone Pickens' view, as expressed to Joe Kernen, that the conventional peak is the one that matters.


thanks for sharing