
Why The S&P 500 Index Keeps Hitting All Time Highs
Recently I stumbled upon something unique in doing my historical technical analysis of the S&P 500 Index and thought I would share it with everyone here on TalkMarkets. Statistical Indicator Analysis or SIA is a form of technical analysis that I created years ago and for those of you new to this analysis, I welcome you to read this introduction by going here.
I am also a quantitative analyst and have determined from my free cash flow research that many stocks in the S&P 500 Index are fully to overvalued, but have been unable to explain why (from a quantitative point of view) the markets continue to go up despite being so overvalued? Of course with interest rates being so low and with Central Bankers throughout the world doing quantitative easing, they in fact are driving asset prices higher by manipulating the markets. Thus from a macro-economic point of view, that explains a lot. Unfortunately gravity plays a major role in how stock prices act and I have to turned to technical analysis in my attempt to explain why markets keep going up, as my quantitative analysis has not been able to do so.
First let us begin by showing you my Historical Statistical Indicator Analysis Chart of the S&P 500 Index.:
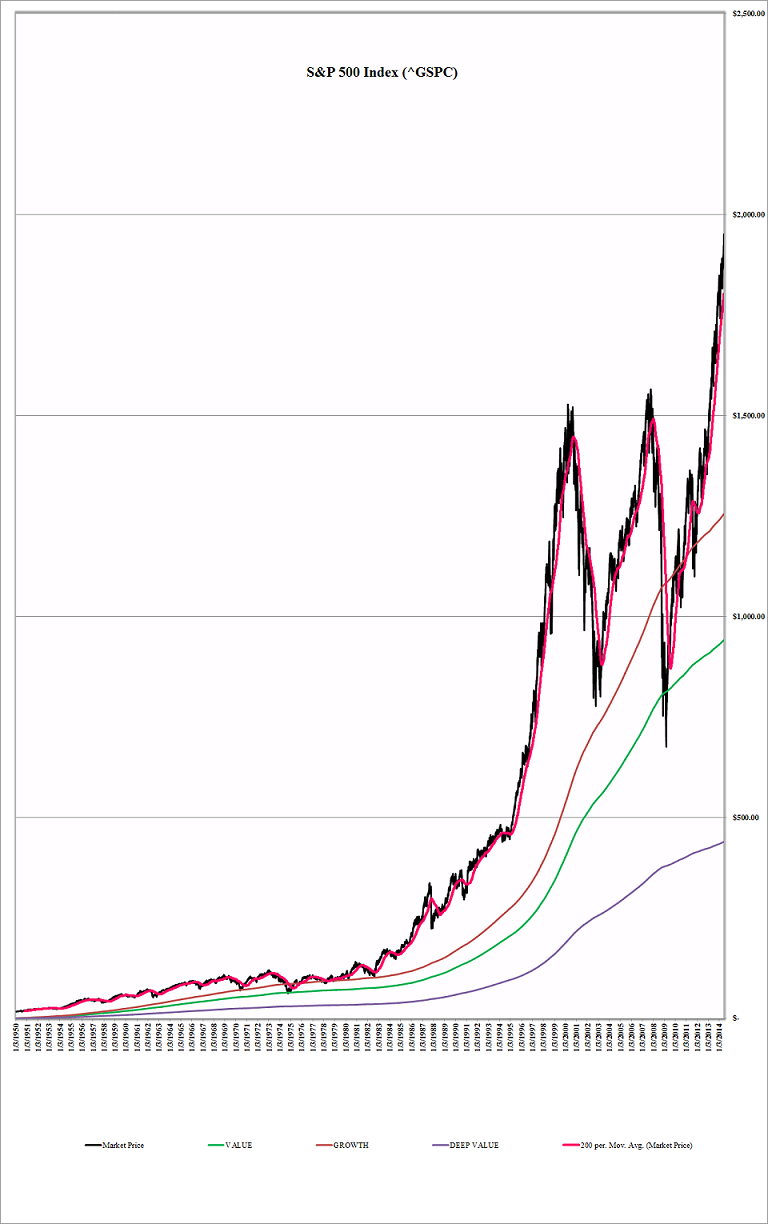
When you first look at the chart above, it seems like the S&P 500 Index has spiked up to incredibly overvalued levels in breaking through prior market tops and this even fooled me for a while, until I discovered this the other day.
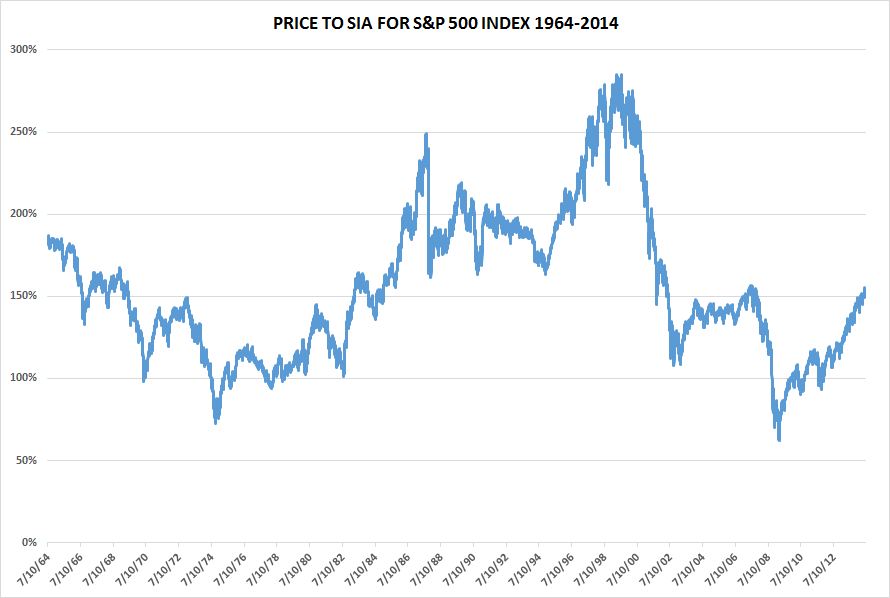
What this chart does is take the S&P 500's price level and divide it by its 3650 trading day moving average. By repeating this process for each date, over the last 50 years, we can thus determine how we currently relate to other periods in market history. For example the period we are currently in signals that the S&P 500 Index is not overvalued compared to the market tops of 1987 and 1999. It also explains why the 1974 and 2009 market bottoms were once in a lifetime opportunities to buy stocks. The reason that stocks appeared to be overvalued, from a technical point of view, when you first look at the first chart above is because the S&P 500 Index fell so heavily in 2008-2009 that it has distorted everything. Basically the markets were not overvalued in 2007 in comparison to 1987 and 1999 but crashed nevertheless because certain sectors, like the financial sectors, just imploding due to massive corruption and financial scandals that surfaced like subprime. Since most investors tend to invest in indicies and ETF's, the subprime crisis uncovered all the corruption in a shocking way and started a domino effect that resulted in the S&P 500 hitting its lowest level ever (from a price to SIA point of view).
Therefore historically the S&P 500 Index, from a long term technical point of view, is not overvalued, but is about fairly valued and has a lot of room to go up before it becomes fully valued. If the US economy can just reach a 3-4% growth rate, then corporations will do very well and their free cash flow results will improve dramatically, thus allowing my quantitative and technical indicators to align in perfect harmony and give off a stronger signal that the markets may go much higher. Though the S&P 500 Index from a technical point of view is not overvalued it surely is from a quantitative analysis point of view, when you analyze each component of the Index individually. So I have split the difference and since I run a very conservative advisory, I am currently 52% in stocks and 48% in cash and am waiting to see if the US will improve or not.
Always remember that these are the results of our research based on the methodology that I have outlined above and in other articles previously published. This research is provided as an ...
more

