
Why The M2 Slowdown Doesn’t Blunt My Inflation Concern
We are now all good and focused on the fact that inflation is headed higher. As I’ve pointed out before, part of this is an illusion of motion caused by base effects: not just cell phones, but various other effects that caused measured inflation in the US to appear lower than the underlying trend because large moves in small components moved the average lower even while almost half of the consumption basket continues to inflate by around 3% (see chart, source BLS, Enduring Investments calculations).
But part of it is real – better central-tendency measures such as Median CPI are near post-crisis highs and will almost certainly reach new highs in the next few months. And as I have also pointed out recently, inflation is moving higher around the world. This should not be surprising – if central banks can create unlimited amounts of money and push securities prices arbitrarily higher without any adverse consequence, why would we ever want them to do anything else? But just as the surplus of sand relative to diamonds makes the former relatively less valuable, adding to the float of money should make money less valuable. There is a consequence to this alchemy, although we won’t know the exact toll until the system has gone back to its original state.
(I think this last point is underappreciated. You can’t measure an engine’s efficiency by just looking at the positive stroke. It’s what happens over a full cycle that tells you how efficient the engine is.)
I expect inflation to continue to rise. But because I want to be fair to those who disagree, let me address a potential fly in the inflationary ointment: the deceleration in the money supply over the last year or so (see chart, source Federal Reserve).

Part of my thesis for some time has been that when the Fed decided to raise interest rates without restricting reserves, they played a very dangerous game. That’s because raising interest rates causes money velocity to rise, which enhances inflation. Historically, when the Fed began tightening they restrained reserves, which caused interest rates to rise; the latter effect caused inflation to rise as velocity adjusted but over time the restraint of reserves would cause money supply growth (and then inflation) to fall, and the latter effect predominated in the medium-term. Ergo, decreasing the growth rate of reserves tended to cause inflation to decline – not because interest rates went up, which actually worked against the policy, but because the slow rate of growth of money eventually compounded into a larger effect.
And so my concern was that if the Fed moved rates higher but didn’t do it by restraining the growth rate of reserves, inflation might just get the bad half of the traditional policy result. The reason the Fed is targeting interest rates, rather than reserves, is that they have no power over reserves right now (or, at best, only a very coarse power). The Fed can only drain the inert excess reserves, which don’t affect money supply growth directly. The central bank is not operating on the margin and so has lost control of the margin.
But sometimes they get lucky, and they may just be getting lucky. Commercial bank credit growth (see chart, source Federal Reserve) has been declining for a while, pointing to the reason that money supply growth is slowing. It isn’t the supply of credit, which is unconstrained by reserves and (at least for now) unconstrained by balance sheet strength. It’s the demand for credit, evidently.

Now that I’ve properly laid out that M2 is slowing, and that declining M2 growth is typically associated with declining inflation (and I haven’t even yet pointed out that Japanese and EU M2 growth are both also at the lowest levels since 2014), let me say that this could be good news for inflation if it is sustained. But the problem is that since the slowing of M2 is not the result of a conscious policy, it’s hard to predict that money growth will stay slow.
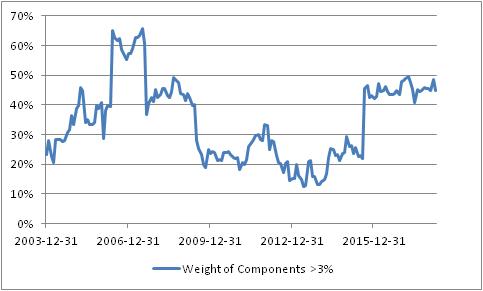
The reason it needs to be sustained is that we care about percentage changes in the stock of money plus the percentage change in money velocity. For years, the latter term has been a negative number as money velocity declined with interest rates. But M2 velocity rose in the fourth quarter, and my back-of-the-envelope calculation suggests it probably rose in Q1 as well and will rise again in Q2 (we won’t know Q1’s velocity until the advance GDP figures are reported later this month). If interest rates normalize, then it implies a movement higher in velocity to ‘normal’ levels represents a rise of about 12-14% from here (see chart, source Bloomberg.[1])

If money velocity kicks in 12-14% over some period to the “MVºPQ” relationship, then you need to have a lot of growth, or a pretty sustained decline in money growth, to offset it. The following table is taken from the calculator on our website and you can play with your own assumptions. Here I have assumed the economy grows at 2.5% per year for the next four years (no mean feat at the end of a long expansion).

The way to read this chart is to say “what if velocity over the next four years returns to X. Then what money growth is associated with what level of inflation?” So, if you go down the “1.63” column, indicating that at the end of four years velocity has returned to the lower end of its long-term historical range, and read across the M2 growth rate row labeled “4%”, you come to “4.8%,” which means that if velocity rises to 1.63 over the next four years, and growth is reasonably strong, and money growth remains as slow as 4%, inflation will average 4.8% per year over those four years.
So, even if money growth stays at 4% for four years, it’s pretty easy to get inflation unless money velocity also stays low. And how likely is 4% money growth for four years? The chart below shows 4-year compounded M2 growth rates back thirty or so years. Four percent hasn’t happened in a very long time.

Okay, so what if velocity doesn’t bounce? If we enter another bad recession, then it’s conceivable that interest rates could go back down and keep M2 velocity near this level. This implies flooding a lot more liquidity into the economy, but let’s suppose that money growth is still only 4% because of tepid credit demand growth and velocity stays low because interest rates don’t return to normal. Then what happens? Well, in this scenario presumably we’re no longer looking at 2.5% annual growth. Here’s rolling-four-year GDP going back a ways (source: BEA).

Well, let’s say that it isn’t as bad as the Great Recession and that real growth only slows a bit in fact. If we get GDP growth of 1.5% over four years, velocity stays at 1.43, and M2 grows only at 4%, then:

…you are still looking at 2.5% inflation in that case.
I’m going through these motions because it’s useful to understand how remarkable the period we’ve recently been through actually is in terms of the growth/inflation tradeoff, and how unlikely to be repeated. The only reason we have been able to have reasonable growth with low inflation in the context of money growth where it has been is because of the inexorable decline in money velocity which is very unlikely to be repeated. If velocity just stops going down, you might not have high inflation numbers but you’re unlikely to get very low inflation outcomes. And if velocity rises even a little bit, it’s very hard to come up with happy outcomes that don’t involve higher inflation.
I admit that I am somewhat surprised that money growth has slowed the way it has. It may be just a coin flip, or maybe credit demand is displaying some ‘money illusion’ and responding to higher nominal rates even though real rates have not changed much. But even then…in the last tightening cycle, the Fed hiked rates from 1% to 5.25% over two years in 2004-2006, and money growth still averaged 5% over the four years ended in 2006. While I’m surprised at the slowdown in money growth, it needs to stay very slow for quite a while in order to make a difference at this point. It’s not the way I’d choose to bet.
[1] N.b. Bloomberg’s calculation for M2 velocity does not quite match the calculation of the St. Louis Fed, which is presumably the correct one. They’re ‘close enough,’ however, for this purpose, and this most recent print is almost exactly the same.


