
Why Individual Investors Do So Poorly In The Market
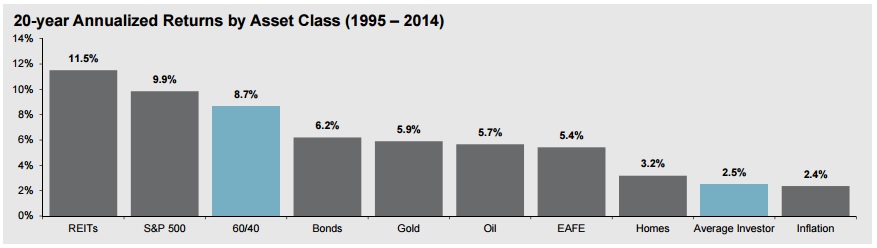
Here is a sobering statistic for you: While the S&P 500 has generated annualized returns of 9.9% over the past 20 years—and a boring old asset allocation of 60% stocks and 40% bonds has managed to return a solid 8.7%—the average investor has eked out a measly 2.5%.
Inflation has averaged 2.4% over the past 20 years, meaning that in real terms the average investor has returned pretty close to zero. And this during one of the best periods in this history of the U.S. stock market.
Source: JPMorgan
How are returns that bad even possible? If the Efficient Market Hypothesis is to be believed, investors should roughly track the S&P 500 over time, not underperform it by 75%.
There are a myriad of answers, including everything from overtrading to underdiversification, but the biggest contributing factor is peformance chasing. Investors don’t park their cash in the stocks or sectors promising the best value. They jump on whatever is trendy in a perpetual case of closing the barn door after the horse has already bolted.
Late last year, veteran financial writer Mark Hulbert crunched the numbers and found that following the investment newsletter portfolio that performed best during the previous calendar year resulted in annual losses of more than 17% per year. Not just underperformance, mind you, but actual losses.
In looking at mutual fund performance, the numbers get a little better but are still remarkably bad. In a study done by Vanguard, a strategy of buying the top-performing large blend mutual funds over a rolling three-year period underperformed a naive buy-and-hold strategy by 34%. And while the numbers varied slightly across mutual fund market caps and styles (small-cap value, mid-cap growth, etc.), a naive buy-and-hold approach outperforms across all. Though we see these words so often we become blind to them, experience proves them true: “Past performance is no guarantee of future results.” To be more accurate, the data here more or less guarantees that past performance is a guarantee of future results…it just so happens that the future performance in question turns out to be terrible.
So, what are we to do about this? Buy an S&P 500 Index Fund (NYSEARCA:SPY), hold it forever, and wash our hands of the entire investing process?
Well, we could do that. But there are better ways to skin this cat.
Take a second look at the chart at the top of this article. You’ll notice that a 60/40 portfolio of stocks and bonds came awfully close to matching the performance of the S&P 500, but what you don’t see here is that it did so while taking far less risk. This is the essence of asset allocation: Essentially sprinkling “a little of everything” into a portfolio and regularly rebalancing with the understanding that there will be years when some pieces of the portfolio perform very well and others perform very poorly.
There is an important catch that a lot of people seem to forget these days. Asset allocation works well when the constituent parts all have reasonably high expected rates of return and–importantly–returns that are not highly correlated.
Asset allocation is going to look a little different today than it did in years past because we are in a very different interest rate environment. I think you can make a very good case for eliminating most bonds altogether or at least for replacing a traditional long-only bond allocation with a tactically-managed one. This is what I have done in portfolios that I manage for clients. And for those clients that qualify, I’ve been incorporating low-volatility, absolute-returns strategies into the mix.
For a simple and easy-to-execute asset allocation, consider something along the lines of the following ETF allocation:
Domestic U.S. Stocks (45%)
17% Cambria Shareholder Yield ETF (SYLD)
11% iShares Select Dividend ETF (DVY)
11% Vanguard Dividend Appreciation ETF (VIG)
6% iShares Core S&P Small Cap ETF (IJR)
International Stocks (21%)
7.5% Cambria Foreign Shareholder Yield ETF (FYLD)
7.5% PowerShares International Dividend Achievers ETF (PID)
3% EG Shares Emerging Markets Consumer ETF (ECON)
3% Cambria Global Value ETF (GVAL)
Real Estate / Infrastructure (24%)
12% Vanguard REIT ETF (VNQ)
12% JP Morgan Alerian MLP ETN (AMJ)
Fixed Income / Cash (10%)
5% PIMCO Total Return Active ETF (BOND)
4% iShares TIPS Bond (TIP)
1% Cash
There is nothing sacred about any of these specific ETF positions. I chose them because I believed them to be a solid proxy for the risk/return exposure I was looking for, but I periodically swap out ETF positions when newer, better alternatives come along. The takeaway is that, while the specific vehicles may change, the asset classes remain pretty constant.
For another perspective, check out The Gone Fishin’ Portfolio. Alex Green chooses a few asset classes that I would avoid–such as gold miners–but his recommendations are solid and simple to implement.
And if you really enjoy digging into asset allocation strategies, check out Meb Faber’s latest, Global Asset Allocation. It’s a short read and worth many times over the $3 price tag.
There a million different ways to allocate a portfolio well, but most poorly-allocated ones have one point in common: They chase whatever has been recently hot. Don’t do that.
Disclosures: Long AMJ, BOND, DVY, ECON, FYLD, GVAL, IJR, PID, SYLD, TIP, VIG, VNQ
Disclaimer: This ...
more


But how would I get my button pushing fix? :-) Seriously though, nice article!