
Why I'm Still On The Sidelines
I'm not a prophet of doom but I'm accumulating cash. I'm selling any stock that is trading below its 100 day moving average and I'm not replacing anything in my personal portfolios. I have an optimism/pessimism index and right now that index is at a negative. I truly believe that in the short run - at least until after the mid-term elections; there is more downside risk to being in the market than there is upside risk to be sitting on the sidelines with your powder dry. Let me document why I think that way.
Let's look at the Market as a whole:
As I write this post just how many stock are trading below their moving averages?
- 83.40% are below their 20 day moving average
- 74.47% are below their 50 day moving average
- 69.32% are below their 100 day moving averages
I use the Value Line Arithmetic Index as my Market proxy because it contains 1700 stock, well over 95% of the entire capitalization of the US stock market and it equally weights all stocks - the big boys do not overly influence this Index:
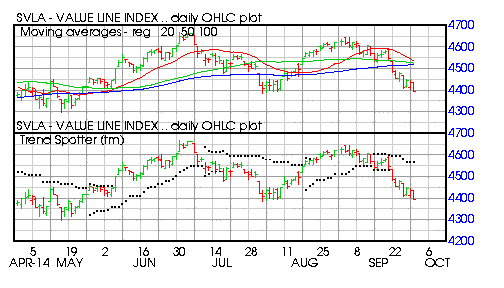
Barchart technical indicators:
- 56% Barchart technical sell signals
- Trend Spotter sell signal
- Below its 20, 50 and 100 day moving averages
- 5.89% off its recent high
- Relative Strength Index 32.60%
I like to stratify the Market by separating the Large Cap, Mid Cap, Small Cap and Micro Caps. The easiest was to do that is to analyze 4 market cap ETF's:
S&P 500 Large Cap Index ETF (NYSEARCA:IVV)
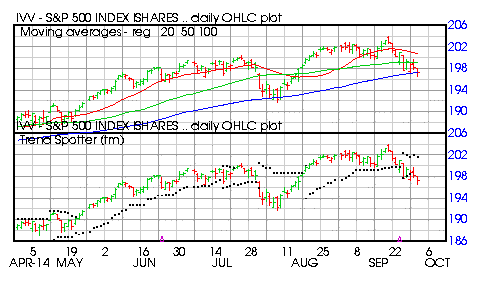
Barchart technical indicators:
- 24% Barchart technical sell signals
- Trend Spotter sell signal
- Below its 20, 50 and 100 day moving averages
- 3.20% off its recent high
- Relative Strength Index 39.08
S&P 400 Mid Cap Index ETF (NYSEARCA:IJH)
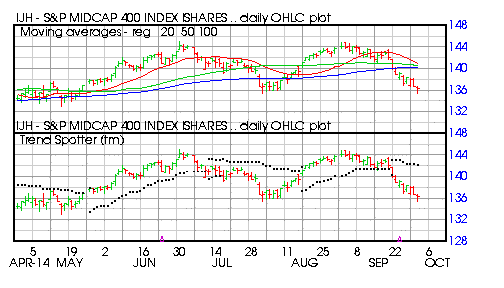
Barchart technical indicators:
- 48% Barchart technical sell signals
- Trend Spotter sell signal
- Below its 20, 50 and 100 day moving averages
- 5.91% off its recent high
- Relative Strength Index 30.15%
S&P 600 Small Cap Index ETF (NYSEARCA:IJR)
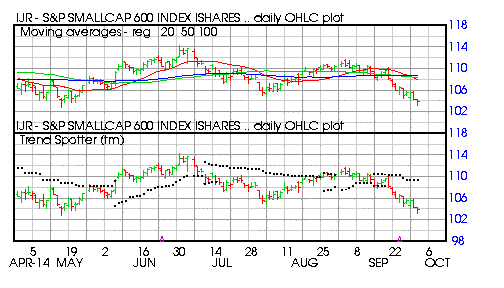
Barchart technical indicators:
- 96% Barchart technical sell signals
- Trend Spotter sell signal
- Below its 20, 50 and 100 day moving averages
- 8.93% off its recent high
- Relative Strength Index 30.73%
Russell Micro Cap Index ETF (NYSEARCA:IWC)
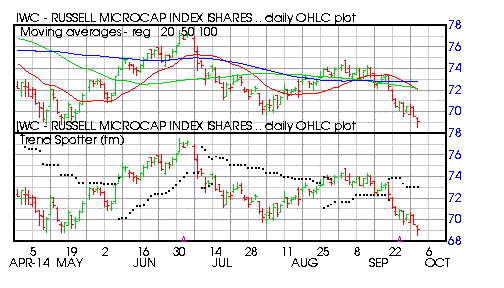
Barchart technical indicators:
- 96% Barchart technical sell signals
- Trend Spotter sell signal
- Below its 20, 50 and 100 day moving averages
- 14.27% off its recent high
- Relative Strength Index 31.60%
I am not in a full blown Market Panic -- For me that happens when the whole Market is off 10%. You can see that the Micro Caps are already there and the Small Caps are almost there. The Large and Mid Caps aren't there yet but isn't it obvious which way they are trending???
My Plan:
1 - Trim off from my holdings any positions that are not trading above their 100 day moving averages and leave those proceeds in cash until either the Market recovers and I begin to accumulate new positions again or;
2- The Market as reflected in the Value Line Index is off 10% at which time I will consider buying some Inverse ETF's like some of the ProShares Short Market Cap ETFs.
Disclosure: None


