
Who Knows What Will Black Gold Do In Coming Week?
On Thursday, crude oil moved a bit higher as oil investors turned their attention to the North Sea supply disruption. Although the price of black gold increased, the technical picture of the commodity doesn’t bode well for oil bulls. Why?
Yesterday, crude oil came back above $57 as oil investors focused on the Forties pipeline, which carries North Sea oil to Britain. Nevertheless, we should keep in mind that the above-mentioned disruptions will physically mostly affect the North Sea region. In other words, we think that the shale drilling and the last week increase in the U.S. production (which approached the output levels of top producers - Russia and Saudi Arabia) are more important for the price of light crude. Therefore, in our opinion, it is worth waiting for today's Baker Hughes report before we get excited about yesterday's increase and its “bullish” implications. Having said that, let’s examine the technical picture of crude oil (charts courtesy of http://stockcharts.com).
Crude Oil’s Technical Picture
(Click on image to enlarge)
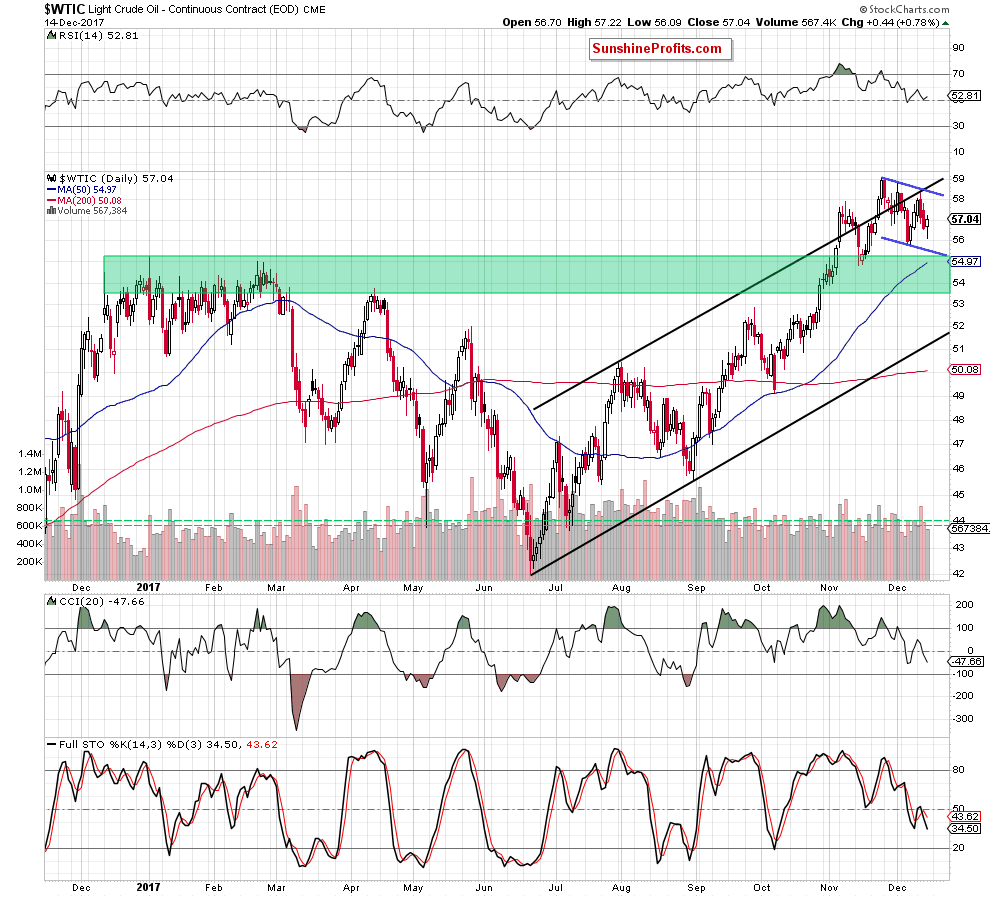
Looking at the daily chart, we see that crude oil approached December lows, which encouraged oil bulls to act. As a result, black gold rebounded slightly, but did this “increase” change anything in the short term?
In our opinion, it didn’t and there are several reasons for this assumption. Firstly, light crude remains in the blue declining trend channel, which means that as long as there is no breakout above the upper border of the formation, another bigger move to the upside is not likely to be seen.
Secondly, the commodity is trading below the upper line of the black rising trend channel, which means that the verification of the earlier breakdown and its negative impact on the price are still in effect.
Thirdly, the bearish engulfing pattern continues to block the way to higher prices, which doesn’t bode well for oil bulls. As a reminder, how can we interpret this candlestick formation from the psychological point of view? Those traders, who had long positions decided to close them after an increase to the upper line of the trend channel, which resulted in a decline. Those who joined the last part of the upward move didn’t withstand the pressure and began to close their positions in fear of losses, which caused that the price of crude oil continued to fall.
Therefore, in our opinion, the bearish engulfing pattern is an additional signal for investors to open even more short positions, which due to the absence of the opposite side (the previous ones who closed their positions due to fear of losses will not re-open them in the same direction) will push the price even lower in the coming week.
Fourthly, the size of volume, which accompanied yesterday’s increase was visibly lower than what we saw during recent declines, which increases the probability that oil bulls may not be as strong as their opponents. At this point, it is worth noting that many times in the past similar differences in the size of volume were the first signs of declines.
Fifthly, the sell signals generated by the daily indicators remain in cards, supporting further deterioration in the coming week.
Are there any other negative signs, which could encourage oil bears to act in the coming week? Ooh yes, they are. Let’s take a closer look at the weekly chart below.
(Click on image to enlarge)
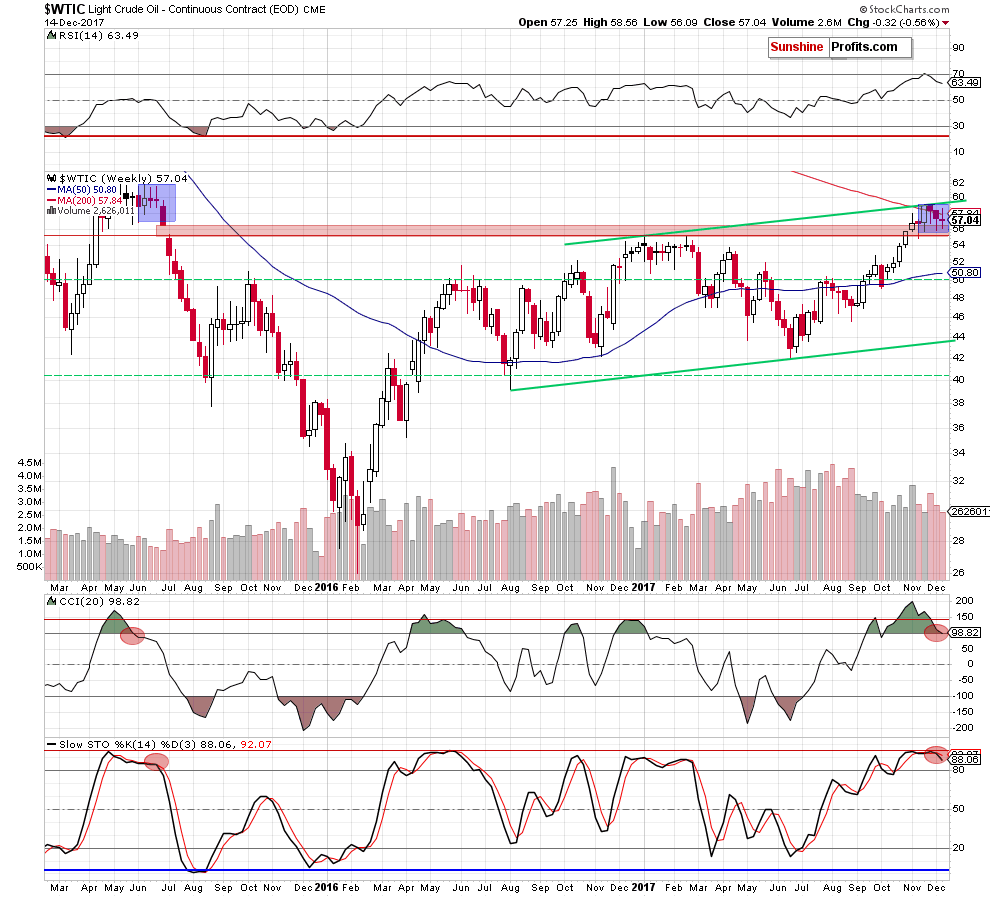
From the broader perspective, we see that although crude oil rebounded at the beginning of the week, black gold pulled back, which resulted in a comeback under the 200-week moving average. Nevertheless, this negative sign will turn into bearish if light crude closes today’s session below $57.84.
But returning to the negative signals, please keep in mind that the sell signals generated by all weekly indicators also supports oil bears and lower prices of light crude in the coming week.
On top of that, when we focus on the above chart, we can notice one more negative fact – a similarity to what we saw in June 2015. Back then, crude oil also remained in the consolidation for several weeks (marked with blue). What’s interesting, these were similar levels to those, which we observe on the charts now (the November peak was in the middle of the 2015 consolidation). What happened after that?
As you see on the weekly chart, the breakdown below the lower line of the formation preceded not only the red gap, but also a significant decline in the following weeks. Will we see a similar price action later this month?
Taking into account two very important additional resistances (the upper border of the green rising trend channel and the 200-week moving average), the above-mentioned sell signals (we also saw them in 2015) and the short-term picture of the commodity, the bearish scenario is much more likely for us than the price increase above the level of $60.
Such negative development (for oil bulls, not for us who already have profitable short positions) is also justified and more likely when we consider the long-term perspective. Let's analyze together the monthly chart below.
(Click on image to enlarge)
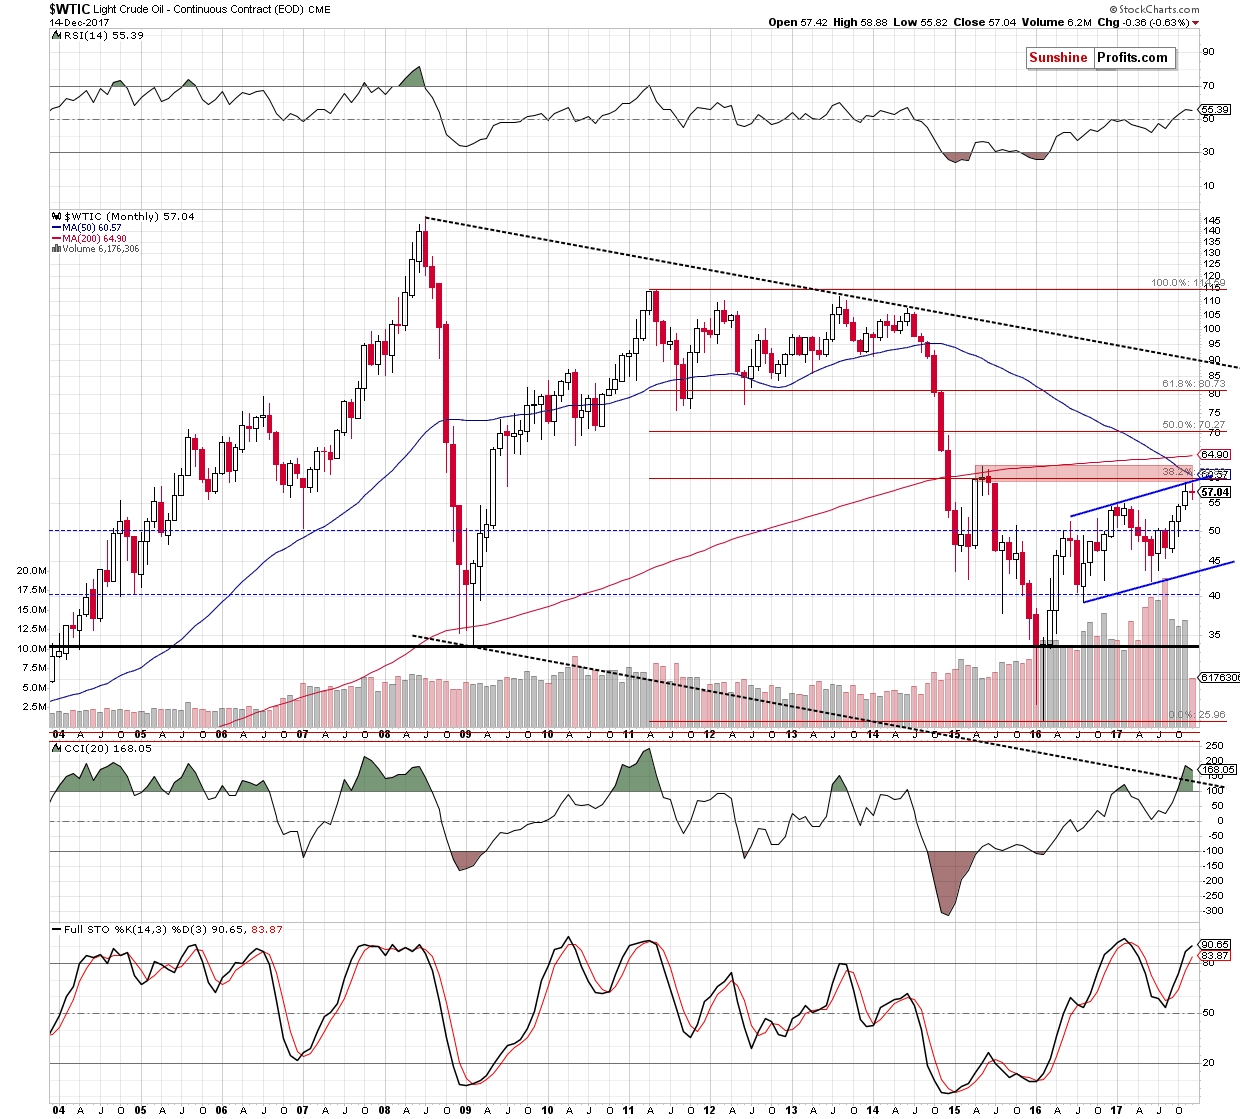
Looking at the above chart, we see that crude oil is trading not only below the upper border of the trend channel, but also under the very important red zone (created by the 2015 peaks), which remains the major resistance since mid-2015. As you see, this area is also reinforced by the 50-month moving average and the 38.2% Fibonacci retracement based on the entire 2011-2016 downward move.
What does it mean for crude oil and the bulls? In our opinion, as long as there is in breakout above this key resistance zone, the way to higher prices is blocked. In other words, a reversal and bigger move to the downside is just around the corner.
So, how low could crude oil fall first? In our opinion, if light crude extends losses from current levels, we’ll see (at least) a drop to around $54.81-$55.24, where the January peak, the mid-November lows and the lower border of the very short-term blue declining trend channel are. If this support area is broken, the way to lever levels will be open.
Summing up, short positions continue to be justified from the risk/reward perspective as crude oil remains under the upper line of the black rising trend channel, the upper line of the blue declining trend channel (seen on the daily chart), the 200-week moving average and the key resistance zone marked on the monthly chart. Additionally, the sell signals generated by the weekly and daily indicators together with the bearish fundamental factors increase the probability of further declines in the coming week(s).
Very short-term outlook: bearish
Short-term outlook: mixed with bearish bias
MT outlook: mixed
LT outlook: mixed


