
Where Is The Floor? Weekly Market Outlook
Once the bearish ball got rolling last week, it got rolling in spades. In retrospect, however, the pullback makes sense in terms of when, where, and why. The S&P 500 (SPX) (SPY) as well as the NASDAQ Composite (COMP) both bumped into major technical ceilings, and right on cue, began a retreat that likely isn't over yet.
We'll dissect the breakdown below, as always. First though, we need to run down last week's and this week's key economic numbers.
Economic Data
Though a light week in terms of the total amount of economic data, last week was a huge week for real estate. We got a glimpse of new as well as existing home sales, in addition to the FHFA's measure of home pricing.
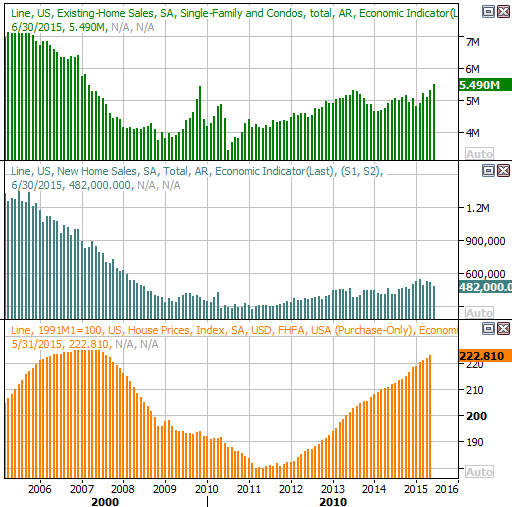
Broadly speaking, the real estate picture continues to look good. Existing home sales soared to a multi-year high pace of 5.49 million in June, up 170,000 from May's rate of 5.32 million. New home sales fell from a pace of 517,000 to 482,000 last month… a difference of 35,000. Though the data-breakdown doesn't bode well for homebuilders, the trend in sum bodes well for real estate in general.
New and Existing Home Sales, FHFA House Price Index Chart
Source: Thomas Reuters
And, regardless of whether buyers are buying new or existing homes, the FHFA Housing Price Index for May once again indicated an increase in home prices.
Everything else is on the following grid:
Economic Calendar
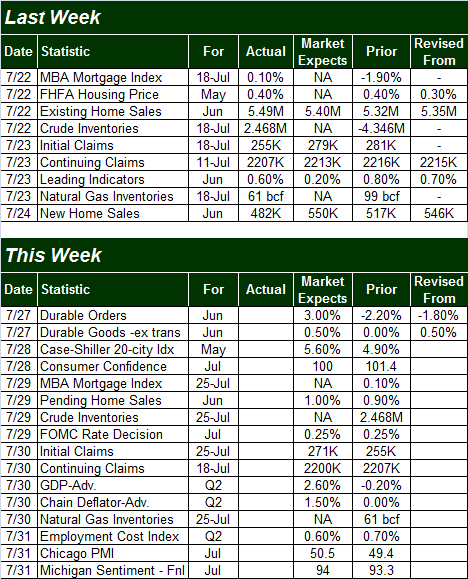
Source: Briefing.com
The coming week will be a little busier than last week was in terms of economic news, but all eyes will be on one highlight… Wednesday's interest rate decision from the Federal Reserve's Open Market Committee. Though the odds continue to point to at least one rate hike this year, it's not expected to happen with this particular opportunity the FOMC has to do so.
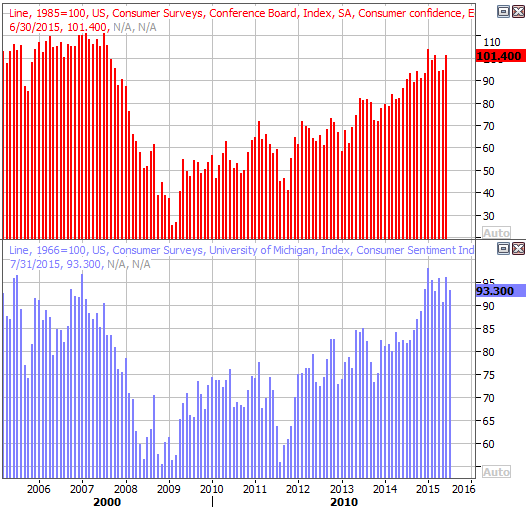
It's also going to be a big week for consumer sentiment. We'll hear the Conference Board's consumer confidence score for July on Tuesday, and we'll get the final reading on the Michigan Sentiment Index for July on Friday. Both are still generally trending higher, but a disappointing reading from either or both this time around could cause trouble for this already-vulnerable market.
Consumer Sentiment Trend Charts
Source: Thomas Reuters
Stock Market Index Analysis
As was noted already, last week's mini-meltdown was not surprising. The rally effort was slowing down as of Friday of two weeks ago, and Monday's doji bar was made the same day the S&P 500 finally bumped into its June peak of 2130. If there was any ideal point for the bears to take charge again, that was it. Sure enough, they did, sending stocks lower for four straight sessions after that. The downtrend was still picking up speed as of the end of last week. We have to assume the selloff is going to run its full course.
Bolstering the bearish argument is the way the CBOE Volatility Index (VIX) (VXX) has also started to push higher, up and off a well-established floor at 12.0. The unusually strong bearish volume this week is also quite telling.
S&P 500 & VIX Daily Chart
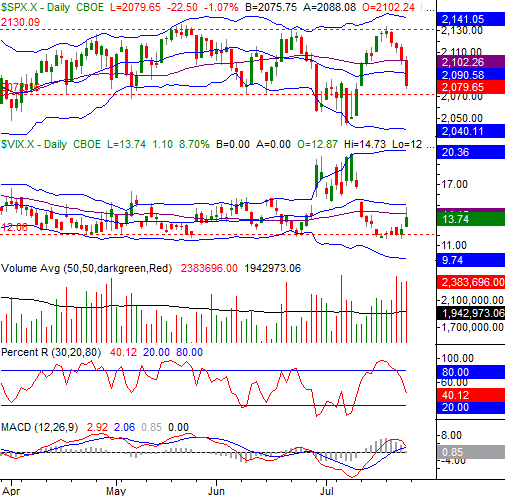
Chart created with TradeStation
While the downtrend has crossed a key confirmation line by virtue of the S&P 500's dip under its 20-day and 50-day moving averages, it's important to understand that so far, this is nothing more than a relatively normal ebb and flow, and not necessarily the beginning of a major correction.
Based on recent history, we have good reason to think the S&P 500 will find support at its lower Bollinger band near 2040. That's also pretty close to where the index hit bottom in early July; there's at least something of a psychological floor there… not to mention a technical one.
The same idea applies to the VIX. That is, while the VIX has a good shot at reaching its upper band line at 20.36, it would be out of character for the VIX to move beyond that technical ceiling where it also peaked just a couple of weeks ago.
The daily chart of the Nasdaq Composite looks similar, though not identical. That is, the composite is simply making a return trip from a rally to its upper Bollinger band, and is apt to be en route to its lower Bollinger band currently near 4878. That's also roughly where the Nasdaq found a floor in early May as well as early July.
NASDAQ Composite & VXN Daily Chart
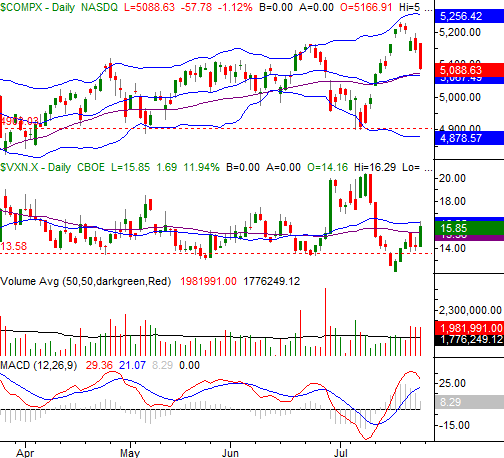
Chart created with TradeStation
With all of that being said, it should be made clear that although the longer-term momentum is clearly waning, there's no firm evidence that this lull is anything more than just another blip. All the same, it's not too soon to start thinking about what a bigger correction might look like.
The weekly chart of the S&P 500 puts things in perspective. Visually, the uptrend has slowed for months now… almost to a sideways trend. The falling MACD lines verify this. While a break under the 200-day moving average line (green) would be a major red flag, the tipping point in this situation is more likely the lower 26-week Bollinger band currently at 2033.6. A move under that mark will be a strong sign that the short-term weakness is morphing into long-term weakness.
S&P 500 & VIX Weekly Chart
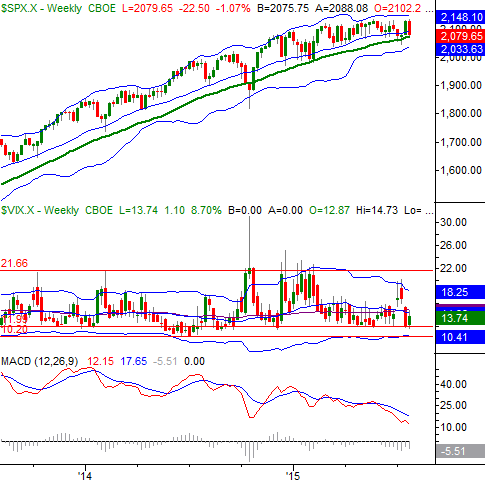
Chart created with TradeStation
The added confirmation that the pullback is picking up significant steam would be a Percent R line that remains below the 20 level and MACD lines that are under the zero mark on this longer time frame chart. We'll talk about that in detail if and when those occur. This market may well bounce out of trouble before the bears carry it past the point of no return.
Earnings Lower, But Not Dramatically
Though earnings season isn't over yet, with half of the market's companies having reported in, we can start analyzing the fundamental data the numbers are telling us.
As of the latest numbers, the S&P 500 is on pace to earn $28.41 per share for the second quarter, down 3.17% from the year ago levels. The EPS trend and the year-over-year changes over time are plotted on the chart of the S&P 500 below.
S&P 500, With Earnings Trend and YOY Growth Chart
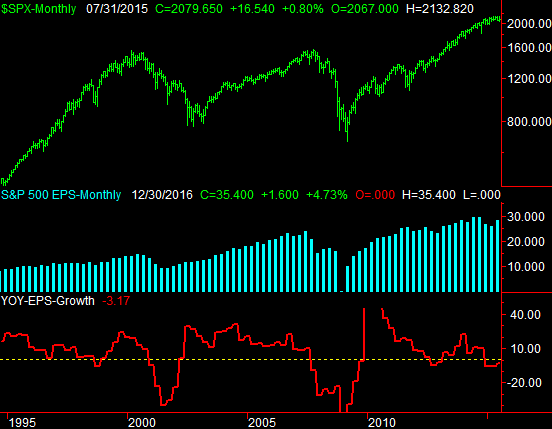
Chart created with TradeStation
Considering oil companies were still making good money during the second quarter of last year, a 3.17% slide in income doesn't seem too bad. That's because it isn't.
Amazingly enough, only the energy (XLE), materials (XLB), and industrial (XLI) sectors are reporting a dip in year-over-year earnings for Q2. All other sectors are reporting an increase in earnings for the second quarter. Not counting the energy sector's 57% plunge in earnings (but still including the lackluster industrials and materials), the average Q2 earnings growth rate is a solid 2.45%. Removing the 17% plunge in materials earnings, the average second quarter earnings growth rate rises to 4.9%. Until then though, the energy sector is weighing the broad market down.
Disclosure: None.


