
When Wall Street Gets DeFANGed—Look Out Below!
As the stock market labored into Friday’s close, CNBC was apparently tying to help with a crawler saying that the S&P 500 was heading for its “best week of the year”. Then again, the gain of just 1% since New Year’s Day is not a whole lot to write home about.
In fact, there were some fireworks in this week’s gains, but if history is any guide they were exactly the kind of action that always precedes a thundering bust. To wit, the market has narrowed down to essentially four explosively rising stocks—the FANG quartet of Facebook (FB), Amazon (AMZN), Netflix (NFLX) and Google (GOOGL)—which are sucking up all the oxygen left in the casino.
At the turn of the year, the FANG stocks had a combined market cap of $740 billion and combined 2014 earnings of $17.5 billion. So a valuation multiple of 42X might not seem outlandish for these race horses, but what has happened since then surely is.
At this week’s close, the FANG stocks were valued at just under $1.2 trillion, meaning they have gained $450 billion of market cap or 60% during the last 11 months—even as their combined earnings for the September LTM period were up by only 13%.
In a word, the gamblers are piling on to the last train out of the station. And that means look out below!
Indeed, the chart of the broad market (S&P 500) should be warning enough. It has been choppin’ to nowhere ever since reaching current levels last November.
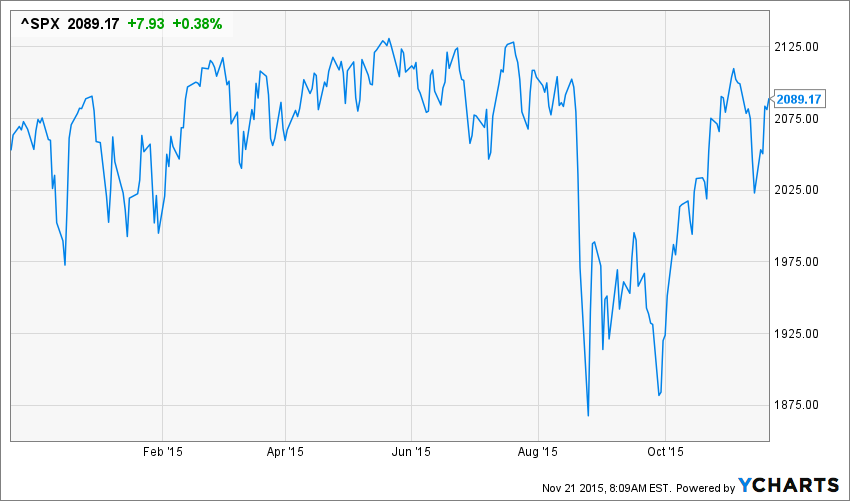
After 27 failed attempts to rally, this week’s 3% gain was surely just another spasm of the dying bull. That’s especially the case coming as it did on the heels of no positive domestic economic news, the onset of the fifth recession in 7 years in Japan, more cratering of credit in China, another plunge lower in Brazil and much of the DM and the specter of a Thermidorian Reaction to the Paris terrorism events in Europe.
An old Wall Street adage holds that market tops are a process, not an event. A peak under the hood of the S&P 500 index, in fact, reveals exactly that.
On the day after Christmas last December the total market cap of the S&P 500 excluding the FANG stocks was$17.70 trillion. By contrast, it closed at $17.26 trillion on Friday, reflecting a 2.5% or nearly half trillion dollar loss of value.
And there is growing deterioration down below for good reason. Notwithstanding the FOMC’s stick save at every meeting this year, each near miss on a rate hike reminded even Wall Street’s most inveterate easy money cry babies that the jig is up on rates.
Sooner or later the Fed would just plain run out of excuses for ZIRP, and now, after 83 straight months on the zero bound, it has. So the truth is, the smart money has been lightening the load all year, selling into the mini-rips shown above while climbing on board the FANG momo train with trigger finger at the ready.

Needless to say, this narrowing process is an old story. It famously occurred in the bull market of 1972-1973 when the impending market collapse was obscured by the spectacular gains of the so-called “Nifty Fifty”. And it happened in spades in the spring of 2000 when the Four Horseman of Microsoft (MSFT), Dell, Cisco (CSCO) and Intel (INTC) obscured a cratering market under the banner of “this time is different”.
But let’s see. It’s more like the same old delusion that trees grow to the sky. At its peak in late March 2000, for example, Cisco was valued at $540 billion, representing a $340 billion or 170% gain from prior year.
Since it had earned $2.6 billion in the most recent 12 month period, its lofty market cap represented a valuation multiple of 210X. And Cisco was no rocket ship start-up at the point, either, having been public for a decade and posting $15 billion of revenue during the prior year.
Nevertheless, the claim was that Cisco was the monster of the midway when it came to networking gear for the explosively growing internet, and that no one should be troubled by its absurdly high PE multiple.
That is, the absurdly inflated values of the Four Horseman in the spring of 2000 looked exactly like the FANG quartet today. Thus, Facebook reported $2.8 billion of net income in the most recent period, thereby weighing in with a 107X PE multiple.
Likewise, Netflix currently trades at 307X its LTM earnings and Amazon at 950X. Even Google, which has now smacked into the law of large numbers with earnings growth of just 11% in the last year, is valued at 32X.
But here’s the thing. The Four Horseman were great companies that have continued to grow and thrive ever since the dotcom meltdown. But their peak valuations were never remotely justified by any plausible earnings growth scenario.
In this regard, Cisco is the poster child for this disconnect. In the interim, it revenues have more than tripled from $15 billion to nearly $50 billion, and its net income has more than tripled to nearly $10 billion per year.
Yet it’s market cap today at $140 billion is just 25% of its dotcom bubble peak. In short, it was driven to the absurd height recorded in March 2000 by the final spasm of a bull market, when the punters jumped on the last momo trains out of the station.

CSCO Market Cap data by YCharts
This time is surely no different. The FANG quartet may live on to dominate their respective spheres for years or even decades to come. But their absurdly inflated valuations will be defanged.
Then look out below.
Disclosure: None.


