
What Usually Happens After A Market Correction
Market Outlook
In the financial media it has been mentioned that in just 13 calendar days, from its January 26 closing high through Friday’s close, S&P 500 declined 10.2%—an official correction. Using a 20% peak to trough decline to define a bear market, the current bull market is 3260 calendar days old, nearly twice as long as average since 1949. The current bull is also the second longest, surpassed by only the great bull market that closed out the last millennium. The current correction is the fourth of the current bull market which is comparable to the numbers recorded by previous bull markets of similar duration.
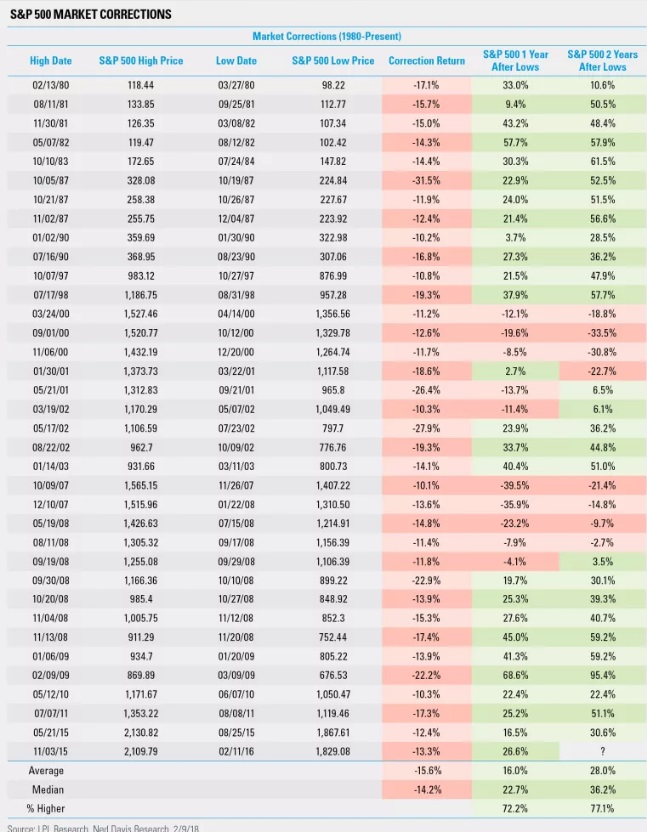
An article posted by LPLResearch talks about how the Dow Jones Industrial Average and S&P 500 Index officially slipped into correction territory last week—marking the fastest move from record levels to correction in history. For reference, a correction is defined as a decline of -10.0% from the most recent high, which in this case occurred just nine days ago on January 26. The Dow has experienced two 1,000-point declines this week, which are larger numbers than investors are used to seeing on a single day; however, it is also important to note that the Dow is much higher now than it was the last time we experienced a significant pullback. The last time the Dow saw a larger percentage pullback in a single day was on August 8, 2011, when it fell 634.76 points to close at 10,809.85—a -5.5% move for the index. To put things in perspective, neither that move, nor the latest two drops (-4.6% and -4.1% on February 2 and February 8, respectively) managed to crack the top 100 declines in history. In the chart below, prior to last week, we have experienced 36 corrections since 1980, and the S&P 500 fell by an average of 15.6% from peak to trough during these periods. Twelve months later, the index made up some ground, rising an average of 16.0% from the low, and after 24 months, the S&P 500 had climbed by an average of 28.0%, reinforcing the need for long-term investors to maintain their diversified strategies. If this is just a run-of-the-mill correction, then we are looking at another four months of pain, history shows. If the losses deepen into a bear market (down 20 percent), then it could be 22 months before we revisit these highs, history shows. "The average bull market 'correction' is 13 percent over four months and takes just four months to recover," Goldman Sachs Chief Global Equity Strategist Peter Oppenheimer said in a Jan. 29 report.
Chief Investment Strategist John Lynch noted in a call to advisors, “it’s important to note that both interest rates and inflation remain low by historical standards, and this bout of volatility is more of a wakeup call for those investors who had grown complacent towards risk, as opposed to a sign of weakness in the broader economy.” On the contrary, as noted last week, economic data continue to point to solid and even accelerating growth, while corporate earnings are still expected to accelerate more than 10% over the balance of the year.
(Click on image to enlarge)
Disclaimer: Futures, Options, Mutual Fund, ETF and Equity trading have large potential rewards, but also large potential risk. You must be aware of the risks and be willing to accept them in order to ...
more

