
What The Crypto Crash And Stock Market Plunge Have In Common
Only one thing matters in bubble markets: perception.
Today saw Jerome Powell sworn into office as the new Chairman of the Federal Reserve, replacing Janet Yellen. Looking at the sea of red across Monday's financial markets, Mr. Powell is very likely *not* having the sort of first day on the job he was hoping for...
Also having a rough start to the week is anyone with a long stock position or a cryptocurrency portfolio.
The Dow Jones closed down over 1,000 points today, building off of Friday's plunge of 666 points. The relentless ascension of stock prices has suddenly jolted into reverse, delivering the biggest 2-day drop stocks have seen in years.
But that's nothing compared to the bloodletting we're seeing in the cryptocurrency space. The price of Bitcoin just broke below $7,000, now nearly two-thirds lower from its $19,500 high reached in mid-December. Other coins, like Ripple, are seeing losses of closer to 80% over the same time period. That's a tremendous amount of carnage in such a short window of time.
And while stocks and cryptos are very different asset classes, the underlying force driving their price corrections is the same -- a change in sentiment.
Both markets had entered bubble territory (stocks much longer ago than the cryptos), and once they did, their continued price action became dependent on sentiment much more so than any underlying fundaments.
The Anatomy Of A Price Bubble
History is quite clear on how bubble markets behave.
On the way up, a virtuous cycle is created where quick, outsized gains become the rationale that attracts more capital into the market, driving prices up further and even faster. A mania ensues where everyone who missed out on the earlier gains jumps in to buy regardless of the price, desperate not to be left behind (this is called fear of missing out, or "FOMO").
This mania produces a last, magnificent spike in price -- called a "blow-off" top -- which is then immediately followed by an equally sharp reversal. The reversal occurs because there are simply no desperate investors left to sell to. The marginal buyer has suddenly switched from the "greater fool" to the increasingly cautious investor.
Those sitting on early gains and looking to cash out near the top start selling. They don't mind dropping the price a bit to get out. So the price continues downwards, spooking more and more folks to start selling what they have. Suddenly, the virtuous cycle that drove prices to their zenith has now metastasized into a vicious cycle of selling, driving prices lower and lower as panicky investors give up on their dreams of easy riches and increasingly scramble to limit their mounting losses.
In the end, the market price retraces nearly all of the gains made, leaving a small cadre of now-rich early investors who managed to get out near the top, and a large despondent pool of 'everyone else'.
We've seen this same compressed bell-curve shape in every major asset bubble in financial history:

And we're seeing this play out in real-time now in both stocks and cryptos.
The Bursting Crypto Bubble
It's amazing how fast asset price bubbles can pop.
Just a month ago, the Internet was replete with articles proclaiming the new age of cryptocurrencies. Every day, new stories were circulated of individuals and companies making overnight fortunes on their crypto bets, shaking their heads at all the rubes who simply "didn't get" why It's different this time.
Here at PeakProsperity.com the demand for educational content on cryptocurrencies from our audience rose to a loud crescendo.
We did our best to provide answers as factually as we could through articles and webinars, though we tried very hard not to be seen as encouraging folks to pile in wantonly. A big reason for this is we're more experienced than most in identifying what asset bubbles look like.
After all, we *are* the ones who produced Chapter 17 of The Crash Course: Understanding Asset Bubbles:
To us, the run-up in the cryptocurrencies seen over 2017 had all the classic hallmarks of an asset price bubble. Which is why we issued a cautionary warning in early December that concluded:
So, if you've been feeling like the loser who missed the Bitcoin party bus, you've likely done yourself a favor by not buying in over the past few weeks. It is highly, highly likely for the reasons mentioned above that a painful downwards price correction is imminent. One that will end in tears for all the recent FOMO-driven panic buyers.
And now that time has shown this warning to have been prescient in both its accuracy and timeliness, we can clearly see that Bitcoin is following the classic price trajectory of the asset price bubble curve. The chart below compares Bitcoin's current price to that of several of history's best-known price bubbles:
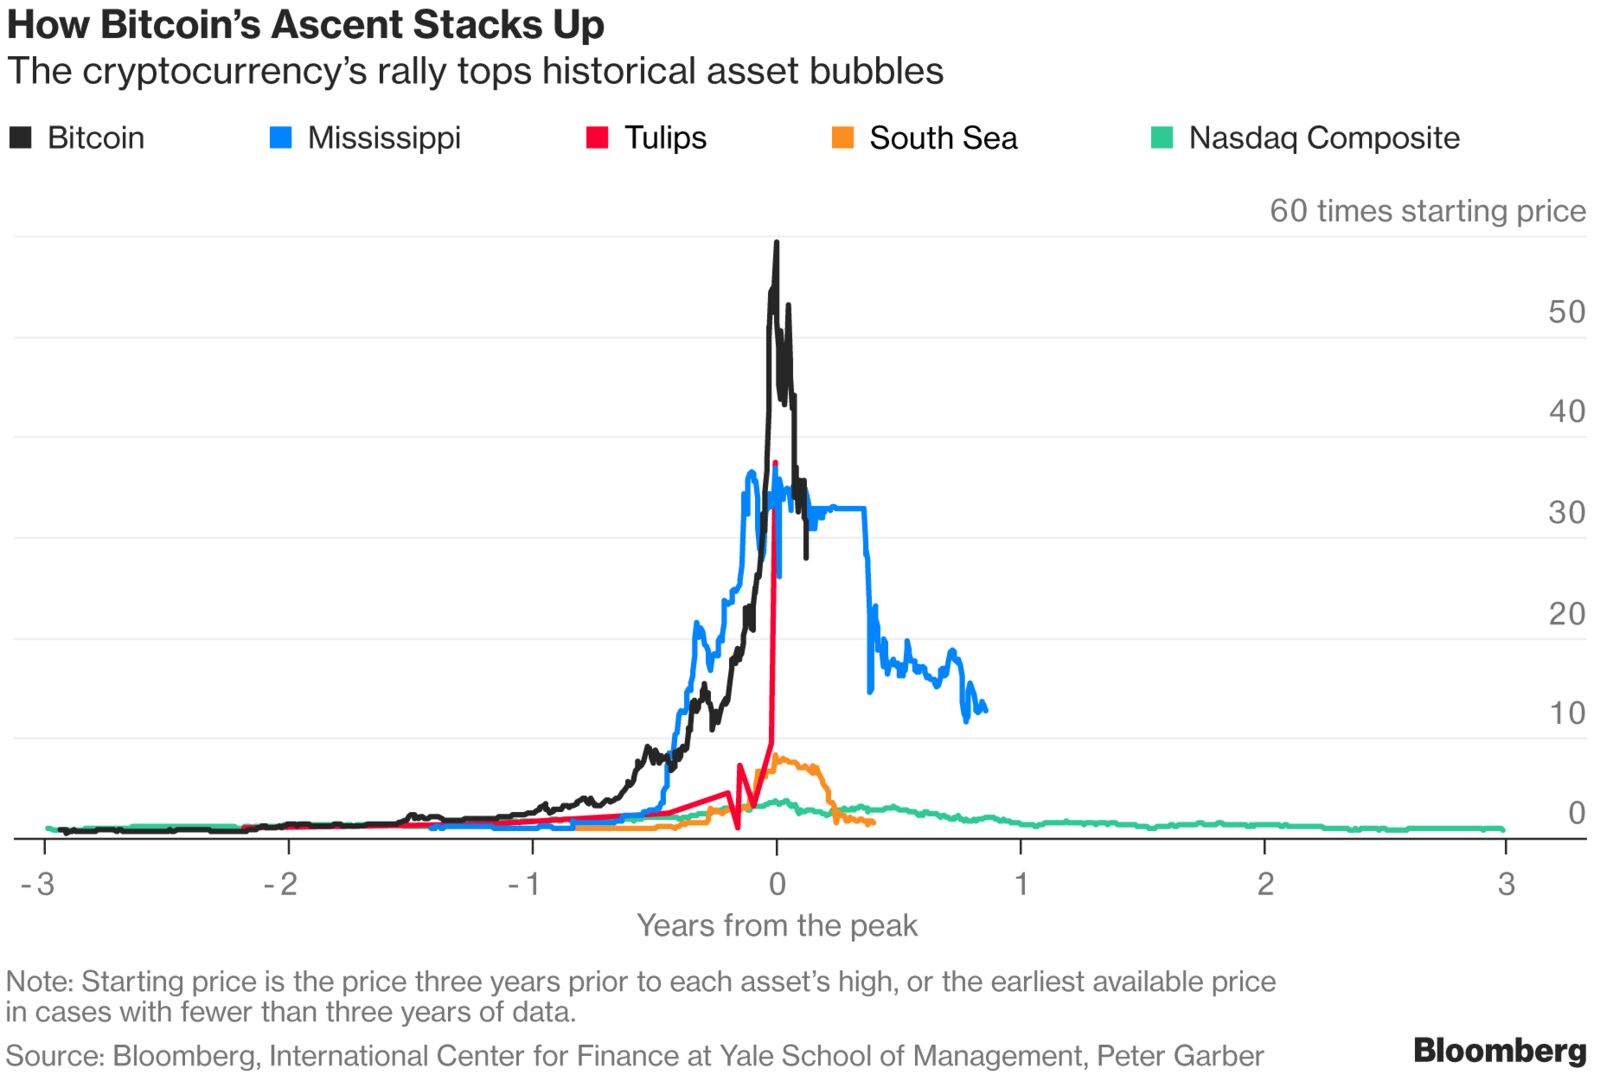
This chart (which is from Feb 2, so it doesn't capture Bitcoin's further decline below $7k) shows that Bitcoin is now about 2/3 of its way through the bubble life-cycle, and about half-way through its fall from its apex.
Projecting from the paths of previous bubbles, we should expect Bitcoin's price to end up somewhere in the vicinity of $2,500-$3,000 by the time the dust settles.
Did The Stock Market Bubble Just "Pop"?
Despite the extreme drop in the stock market over the past two days (by the way, the Dow is now down over 1,200 points), any sort of material bubble retracement has yet to begin -- which should give you an appreciation of how overstretched its current valuation is.
Look at this chart of the S&P 500 index. Today's height dwarfs those of the previous two bubbles the index has experienced this century:
The period from 2017 on sure looks like the acceleration seen during a blow-off top. If indeed so, does the 6% drop we've just seen over the past two trading days signify the turning point has now arrived?

Crazily, the carnage we've seen in the stock market over the past two days is just barely visible in this chart. If indeed the top is in and we begin retracing the classic bubble curve, the absolute value of the losses that will ensue will be gargantuan.
If the S&P only retraces down to the previous HIGHS of its previous two bubbles (around 1,500), it would need to fall over 43% from where it just closed today. And history suggests a full retracement would put the index closer to 750-1,000 -- at least two-thirds lower than its current valuation.
How Spooked Is The Herd?
As a reminder, bubbles are psychological phenomena. They are created when perception clouds judgment to the point where it concludes "Fundamentals don't matter". And they don't. At least, not while the mania phase is playing out.
But once the last manic buyer (the "greatest" fool) has joined the party, there's no one left to dupe. And as the meteoric price increase stops and then reverses, the herd becomes increasingly skittish until a full-blown stampede occurs.
We've been watching that stampede happen in the crypto space over the past 4 weeks. We may have just seen it start in the stock markets.
How much farther may prices fall from here? And how quickly? History gives us a good guide for estimating, as we've done above. But the actual trajectory will be determined by how spooked the herd is.
For a market that has known no fear for nearly eight years now, a little panic can quickly escalate to an out-of-control selling frenzy.
Make no mistake: these are sick, distorted, deformed and liquidity-addicted bubble markets. They've gotten entirely too dependent on continued largess from the central banks.
That is now ending. After so many years of such extreme market manipulation finally gives way, the coming losses will be staggeringly enormous.
The chief concern of any prudent investor right now should be: How do I avoid being collateral damage in the coming reckoning?
Those concerned about what may happen next should read our premium report Is This It? issued over the ...
more


It's a bit amazing that the market didn't realize there is a cost to stimulating an already stimulated market and extending an already extended market. Apparently the dollar's drop that I have been mentioning is affecting the market in that people see inflation and bond yields are rising. Of course, weak trade wars aren't helping the global economy as well and are hurting an already weak dollar.
Strangely the market isn't really correcting that perfectly and we are seeing dumping of already weak stocks as much or more than dumping of favored stocks. I think we will know the final downturn of this route when we see the unfavorable stocks rise and the rest of the market drop. So far I just see across the board dumping which is as disturbing as the recent across the board buying. Sometimes I feel that I am looking for signs of intelligent investing in this market like astronomers look for signs of life in space. Welcome to the manipulated market dominated by mutual funds and indexes. Hmmm....