
What Is Missing To Complete A 'Crash Signature' For 2018
Here is a little more to expand on the posting I made last night here.
We have had a long run-up, with only a few corrections, to new all-time highs.
The market has finally broken and corrected significantly.
You can see comparisons to 1929 and 1987 in the first chart below.
This was forwarded to me by a long time friend with whom I discuss these things.
As I suggested to him and attempted to show in the posting last night, what is required now is a break below the current low, decisively.
That takes the possibility of an inverse head and shoulders bottom off the table and gives us the 'failed rally' scenario.
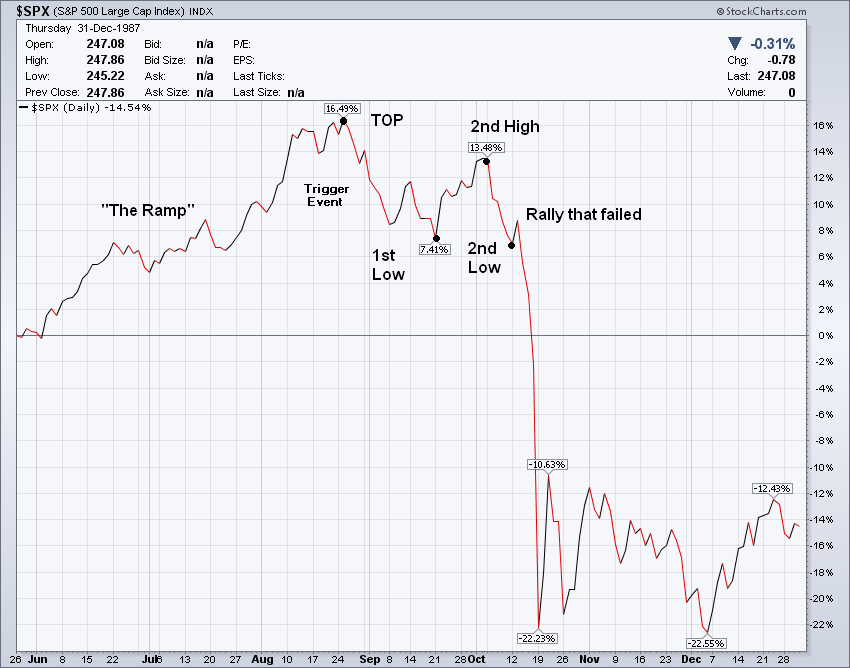
As you can see in 1929 there was a decline from the top of 17+ percent, followed by a rally back of 11+%, that nevertheless failed to make a new high, and rolled back over.
Once the new low was set, the market started its slide.
One issue in the current situation is the calendar. The Thanksgiving holiday is fast approaching.
This is traditionally a period of very light stock market volumes with a bias to a drift higher in preparation for the year-end tape painting known as the Santa Claus rally.
Therefore timing is a bit of a headwind to the failed rally. It may require more of a 'trigger event' but that is very hard to forecast.
So let us be watchful for a market break lower here to a new low.
(Click on image to enlarge)

(Click on image to enlarge)

(Click on image to enlarge)
None.


