
What If I Am Wrong And The Bull Market Is Over?
I have some issues that are taking me away from watching the market. Plus, I need a break from it. So I am posting this mid-day.
The Semiconductors are holding up reasonably well so far, and as long as this index is pointing higher, then I remain optimistic about stocks in general. However, lately it has been hard to stick with this point-of-view partly because volatility and trading volume has been working against this index since late 2017.
(Click on image to enlarge)

Junk Bonds provide a nice indicator for the level of risk in the market. So, I am a lot more comfortable owning stocks when junk bonds are rising along with stocks. At the moment, this junk bond ETF is starting to roll over, and I think it signals that we should reduce overall exposure to stocks on rallies.
(Click on image to enlarge)

So far, shelf support for the SPX is holding even though the 2-year uptrend was broken. This broken trend probably means a new sideways base has to form if there is eventually going to be another leg higher.
(Click on image to enlarge)

The Nasdaq is holding above its 40-week, and the breadth indicators continue to look good.
I would expect breadth to show weakness prior to weakness in stock prices. They should provide advance warning for declines such as in 2015 when breadth rolled over a few months before the severe stock decline in August.
(Click on image to enlarge)

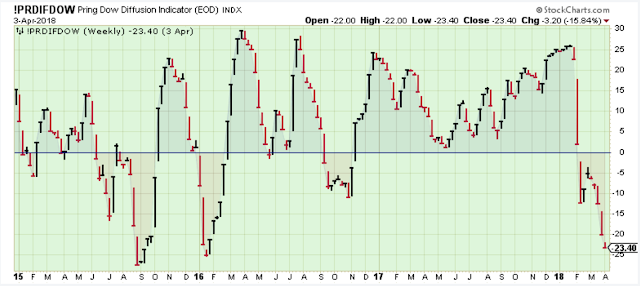
What if I am wrong and the bull market is over? Well, even if the top of the bull was January-2018, I still think we would see a topping process which means there will be some nice bounces off oversold lows.
Based on this indicator (my favorite), we should start to see some strength in stocks, or at least a calm period in which this indicator can bounce back up to the neutral area.
(Click on image to enlarge)
Head and shoulders for the leading small-cap, high-growth stocks? Maybe. The neck line is not well formed and should be upward sloping. But the volume is very interesting. There is such a huge increase in volume starting last September consistent with euphoria, and then the selling volume starts to heavily out number the buying volume consistent with a top.
(Click on image to enlarge)

Here is a look at the enigma known as the price of gold. The price pattern looks like it will head higher, but my guess is lower, although I won't be trading based on my guess. I will go with whatever direction it takes, but I will also keep in mind that sometimes there is a false signal just before a major move such as in December of 2015 when gold dipped to new lows only to turn around immediately into a solid six month run higher.
(Click on image to enlarge)

Outlook Summary:
The market is having a tantrum as the tariff tit-for-tat appears to be getting serious, and the crazies and unqualified are running the White House. However, the fact is that market participants have been way too bullish, and the mood swing away from stocks was inevitable.
I don't think the bull market is over yet, but it is getting old and we have had an incredible run. Time to start appreciating what we have, and protecting it as best we can.
The long-term outlook is increasingly cautious. Reduce overall exposure to stocks on rallies.
The medium-term trend is down.
The short-term trend is down. Looking for signs of the next short-term uptrend.
The medium-term trend for bonds is up.
Disclaimer: I am not a registered investment advisor. My comments above reflect my view of the market, and what I am doing with my accounts. The analysis is not a recommendation to buy, ...
more

