
What Does The Swooning Commodity Index Of 2017 Mean For Gold Miners ?

If you haven't noticed, commodities are diving badly this year:
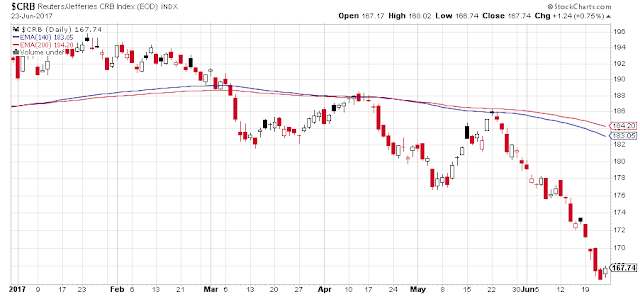
Commodities are consumed by a healthy economy, and dives like this can come before overall downturns. Gold is a commodity that historically is thought to be correlated with the CRB Index. Commodities soared along with gold in the 1970s as capital flowed into hard assets, away from a bad economy. This is all very confusing. So does the bad CRB behavior of late bode ill for gold and the miners now?
Well, if you compare gold and the CRB index over various time frames, you see a somewhat loose correlation. Sometimes they move together, sometimes they don't. But there is one thing the CRB is correlated with much more than gold, and that's oil.
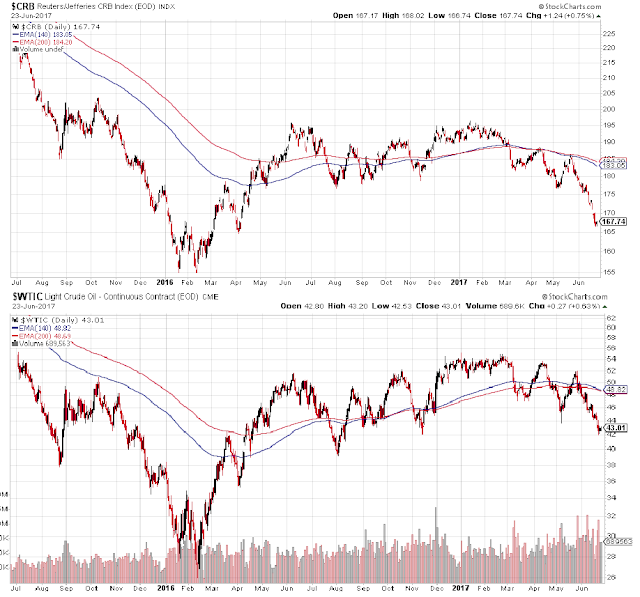
Here we see a broader two year view of the CRB and oil and they look like the very same chart. Since the 2005 massive revision to the CRB index, it mainly does whatever oil does. This oil correlation of the CRB is much tighter than with gold or anything else. The energy complex is about 40% of raw index weighting, but because of the new arithmetic averaging, and oil being much more volatile than most other index components, the CRB winds up being pretty much just the oil chart.
So the real question is "What does swooning oil mean for gold miners? If we look at the year 2001, we have a comparable period where the CRB, much less slaved to oil back then, was also diving like it is this year, and the price of gold wasn't doing much:

Even back then, they were essentially the same chart. Did the gold miners, lacking any clear guidance from the gold price, follow the horrible CRB chart back then?:
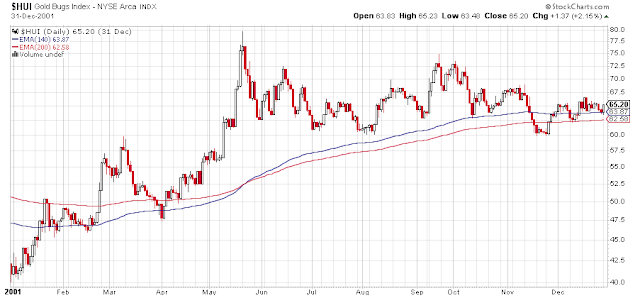
Not really. Here, the miners as represented by the HUI index, did not have a bad year with the commodity dive. The gold price ended the year about right where it started, yet the gold miners did a stunning 60% return. And oil, not gold, was probably a big reason why. Gold mines are some of the biggest energy hogs on earth and when oil goes down, gold mining profits go up. You can't be quite that simplistic as gold stocks have a way of anticipating what the prices of both their product and their inputs are going to be. The gold price was beginning its long ascent the next year in 2002 and the stocks were perhaps getting wind of that. And they seemed to be a few months ahead of oil as well. But by and large, other things being equal, gold mining has a strong inverse relation with oil.
When thinking about the energy costs of gold mining, you first consider the monster trucks, bigger than your house, that carry the ore at 0.3 mpg. This is a big part of it as this article shows, giving us this chart of the climbing diesel use for the top five gold miners:
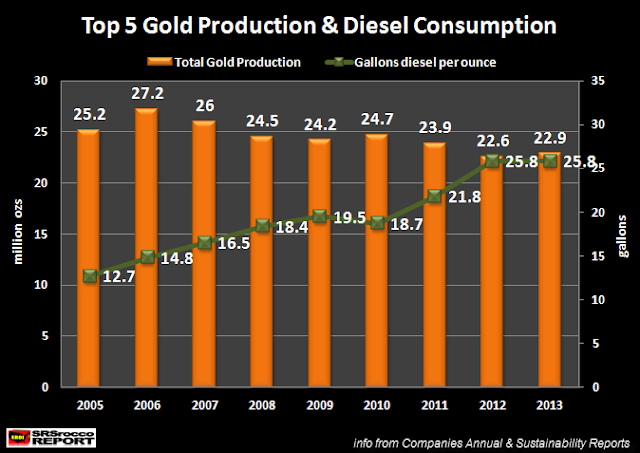
Because the higher ore grades are mined first, the declining grades mean much more rock processed to produce the same amount of gold. This has run diesel usage to a 100% increase the last 10 years producing about the same amount of gold. But the trucking is just a part of overall energy usage. Overall, gold mining is the second most energy intensive product in the world as this British engineering report shows:

Gold is literally off the charts as the arrow points to on this log scale (9000 pound sterling/kg and 6000 Megajoules/kg) and that makes sense when you consider that, as they explain:
Gold is a precious metal which can be sold for a very high price; this means that more energy can be spent in extracting it by mining rocks containing only a small fraction of gold
So they can tolerate a whole bunch of digging and energy use. This is why gold miners typically have total energy cost run roughly a third of their total cost of operation, their biggest single expense. If gold is the second most energy intensive, what is #1? It's diamond mining with many times the energy usage of gold.
Also in the expensive quarter of the above graph is all the metals that makeup the miner's massive equipment. A big chunk of what they don't spend on energy goes to buy and maintain their monster machines. Deflation is good for gold miners. Either inflation or deflation can accompany gold miner climbs as long as currency-in-the-bank is being threatened, as I discussed here. This was the case in the 1920s and '30s when the price of everything went way down, banks failed at record rates, and the gold miners were in massive climbs, both before and after the stock market crash.
As I've written before several times, I think oil will stay moderately priced ($40-$60) for a couple years at least as the shale overcapacity is gradually worked off. If we get a next bull phase for the gold price, gold CEOs will be cheering for the horrible CRB charts shown above and shale will be the gold miners' best friend.
I am long some gold miners.


