
What About Last Time?
Lifetime highs are tricky beasts, because it’s difficult to assess just how much higher values will climb since, by definition, you are in uncharted territory. The psychology is obviously very positive, since all equity buyers are winners, and that tends to feed on itself. But I was curious if there was any portion of market history which resembled what has happened recently on the S&P 500:
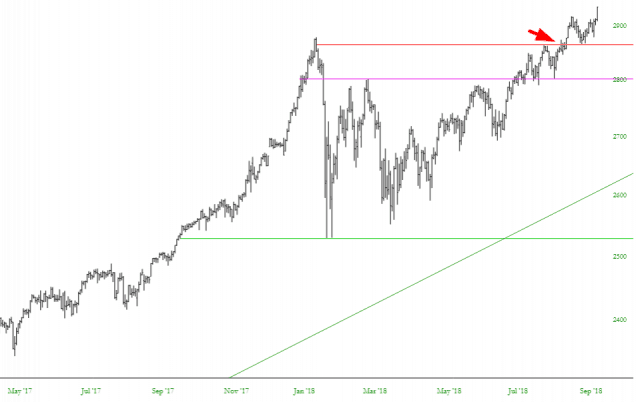
It didn’t take me long to find a similar situation. Specifically, a pattern in which:
- There was a long, steady run-up in price;
- The market went on over months, to oscillate wildly into a new basing pattern;
- Ultimately prices broken above the pattern to highs never seen before
What I found was just a few years ago, and it looked like this:
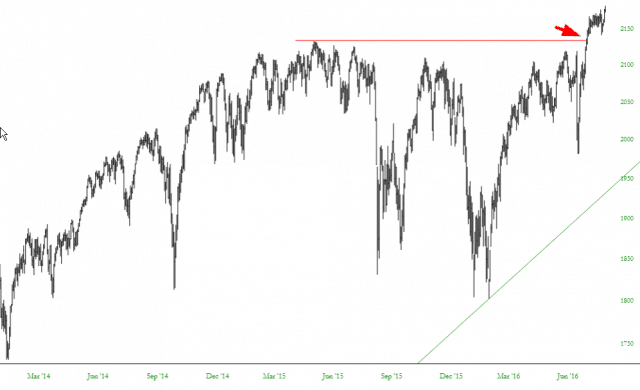
As you can see, both graphs bear the same characteristics that I just laid out.
I wanted to mention one thing, however. During the prior breakout, there was strength for a few weeks, but in spite of being at lifetime highs, the move definitely petered out and spent a few months backing and filling.
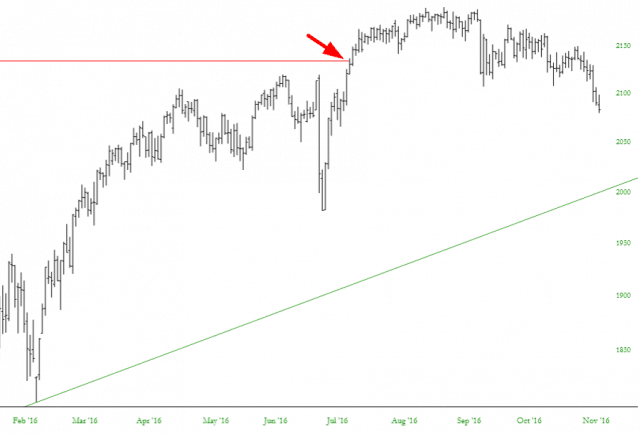
My point being: as bullish as the break to new lifetime highs is, don’t necessarily assume it’ll just continue muscling its way higher for months. Sometimes the momentum from the breakout doesn’t last past a few weeks before the selling takes hold.
Disclaimer: This is not meant to be a recommendation to buy or to sell securities nor an offer to buy or sell securities. Before selling or buying any stock or other investment you should consult ...
more

