
What A Price History Of Drawdowns Says About October Bottoms
October is the stock market’s second most dangerous month based on average drawdown on the S&P 500 (SPY). This year’s October is living up to the reputation after an October, 2017 that never delivered a close below September’s month-ending price. So far this month the S&P 500 has lost 5.0% with a maximum drawdown of 6.4% on a closing price basis. Since 1951, the average maximum drawdown for October is 3.1% and the median is 1.9%.
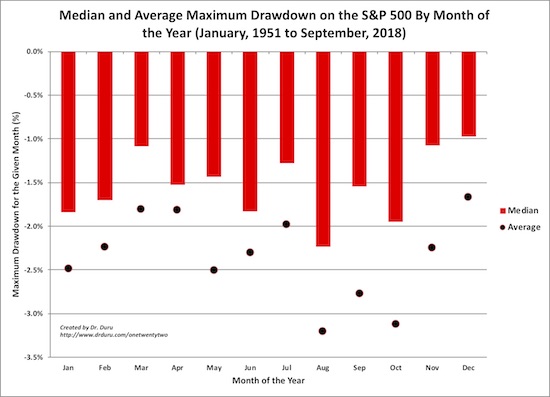
August through October are the S&P 500’s (SPY) most dangerous months based on average maximum drawdown.
Source for data: Yahoo Finance
It is tempting to conclude that this October has likely seen its low since the maximum drawdown has already exceeded the average. However, the historical distribution of outcomes is important. The standard deviation, which covers about 66% of the range of outcomes on either side of the average, is about 5 percentage points. In other words, I want to brace for the potential of a maximum drawdown of 8% or so. That calculation produces a 2681 downside target, or a drop of 3% from Friday’s close.
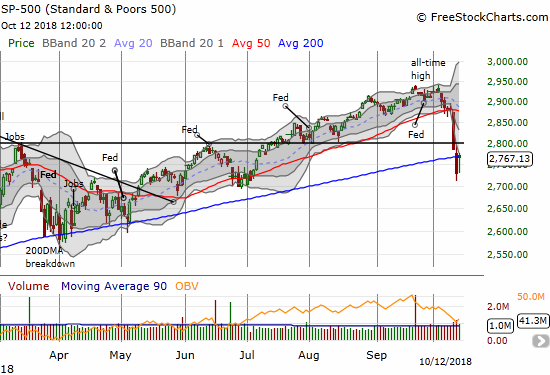
The S&P 500 (SPY) closed right on top of its 200DMA support after sellers almost ruined an opening gap up.
With an average drawdown of 3.1% and a median of 1.9% there is a slight skew to the right for the historic distribution (a shift to the right from what would otherwise be a symmetrical normal distribution). October experienced two extreme outliers with the October, 1987 crash (maximum drawdown of 30.1%) and the collapse of October, 2008 (maximum drawdown of 27.2%) which skew the distribution and inflate the average. Removing those two points gives an average maximum drawdown of 2.1%, a standard deviation of 2.6%, and a median of 1.9%. With THIS adjustment, suddenly it looks likely October, 2018 has indeed hit its bottom already. So it is all a matter of how much we believe the two big crashes of October figure into the realm of future possibilities.
Breadth indicators suggest that market has sold off enough to form a likely bottom, but additional downside risks obviously exist for this month if the market is transitioning from a bullish to a bearish phase.
Disclosure: No positions.
Follow Dr. Duru’s commentary on financial markets via more


