
Weekly Market Outlook - Bullish, But Not Firmly So Yet
Weekly Market Outlook - February 29th, 2016
Last week wasn't a no-holds-barred kind of bullish week, but stocks did manage to follow-through on the prior week's rebound effort, breaking above some semi-important resistance levels. There still a tough road to travel, however, if the bulls are going to get anything going for the long haul.
We'll take our usual look at the market's upside and downside below, after dissecting some of this week's and last week's more important economic data.
Economic Data
Last week was pretty busy in terms of economic news, and more than a little bit of it was important stuff... even if the market didn't read it as such. We also got a couple of curious mixed messages.
Perhaps the most alarming news from last week was the big drop in the Conference Board's consumer confidence reading for February; it fell from January's score of 98.1 to only 92.2 this time around. Not that it had been soaring, but the weak score may have officially started a downtrend. The Michigan Sentiment Survey was equally unimpressive with its a reading of 91.7, down just a bit from January's final reading of 92.0. Although we learned later in the week that consumer spending reached multi-month high growth levels in January, our chart says we may want to be cautious.
Consumer Sentiment Chart
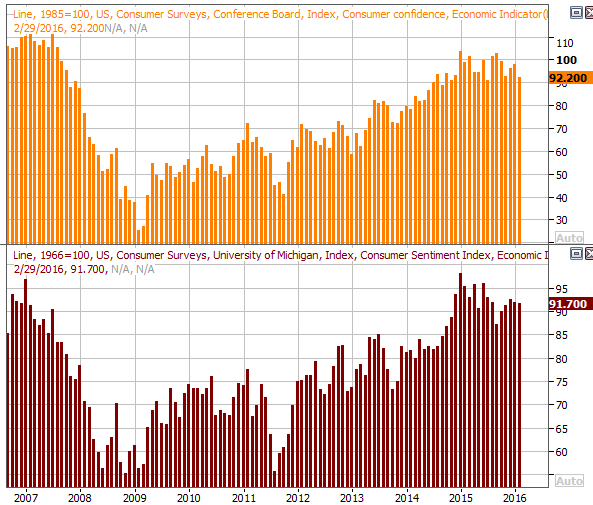
Source: Thomson Reuters
It was also a big, but confusing, week for real estate. Sales of existing houses remained solid at a pace of 5.47 million units, but new home sales slumped to a pace of 494,000, in January, down from December's reading of 544,000. Nevertheless, the bigger trend remains upward, even though we're still nowhere near 2005's peak levels. That just means we have plenty of room to rebound.
New, Existing Home Sales Chart
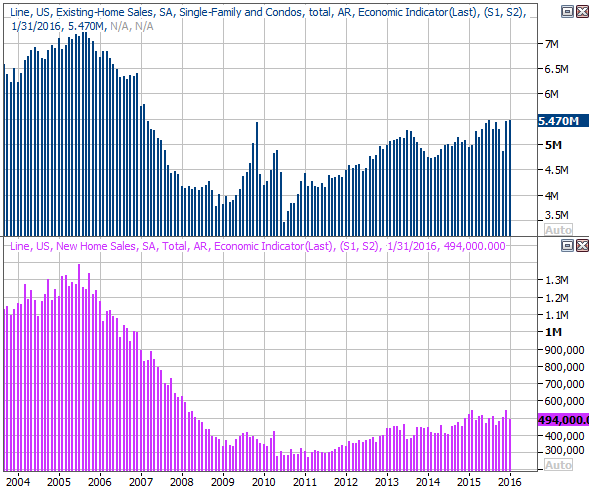
Source: Thomson Reuters
Finally, though there's no need to chart it, it's worth noting that Q4 as GDP growth rate reached 1.0% with its second (of three) score last week. That's a big, upward revision of the 0.7% growth measured the first time around, into the handily beat the 0.4% improvement economists were expecting.
Everything else is on the following grid:
Economic Calendar
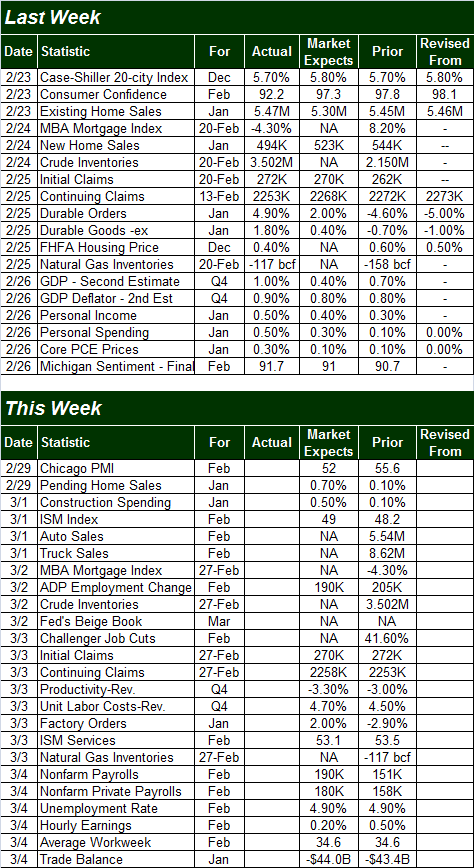
Source: Briefing.com
This week is going to be even busier in terms of the sheer number of economic news items, but little of it is likely to move the market in a big way. In fact, the main news they're really interested in is Friday's employment report for February. Economists believe we'll see job growth reach 190,000 new payrolls, up from January's disappointing 151,000. That won't be enough to move the unemployment rate dial any lower than 4.9%, however. The overall trend is still encouraging.
Unemployment Trend Chart
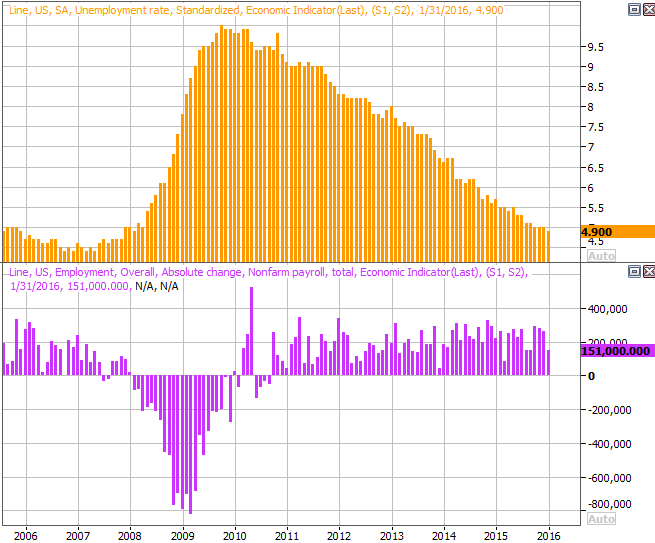
Source: Thomson Reuters
Last but not least, although it's not a particularly good barometer most of the time, the ISM indices have gotten a lot of attention lately simply because one has been indicating a recession for a while now, while the other has danced with the idea by virtue of three consecutive moves lower, and the development of a downtrend. Analysts expect decent readings from the ISM indices for February, but if they fall short, the bears could really take that ball and run with it.
ISM Index Chart
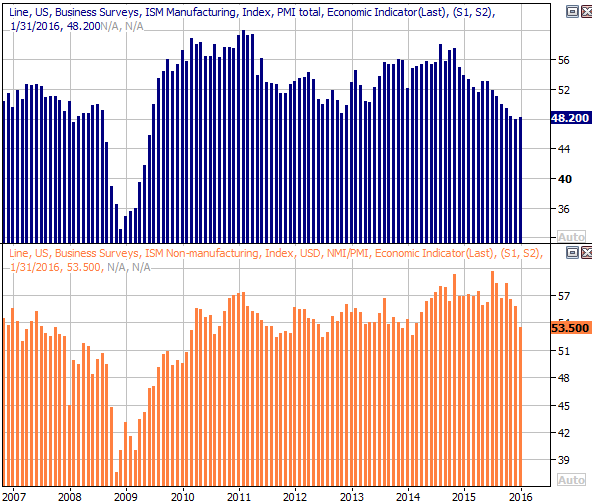
Source: Thomson Reuters
Stock Market Index Analysis
Friday's close may have been a little lackluster, with the major indices peeling back from new multi-week highs to a slightly negative close. Nevertheless, stocks in the week with a respectable gain, and better yet, ended the week above some key technical ceilings.
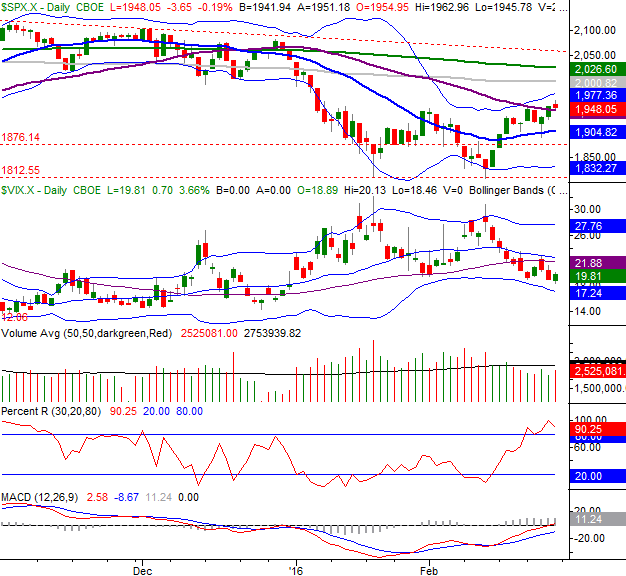
As the daily chart of the S&P 500 (SPX) (SPY) below indicates, the index closed above its 50-day moving average line (purple) on Thursday and remained above that level through Friday. This is the first close above the 50-day line we've seen since late-December. And, in light of the fact that Wednesday's hammer-shaped bar materialized perfectly at the critical 20-day moving average line (blue), this is probably a reasonably reliable bullish cue.
S&P 500 & VIX Daily Chart
Chart created with TradeStation
All the same, there's still plenty of work to be done before this bullishness is reliable enough and meaningful enough to really worry about. Namely, the index needs to make a higher daily close on the same day the Percent R line moves higher again... and the Percent R line can't break back under the 80 level in the meantime. This is a key confirmation we use in many of our trading recommendation services.
If the MACD lines both also move above the zero mark in the foreseeable future without the S&P 500 making a key lower low and break the uptrend effort, that too would be a bullish confirmation.
With all of that being said, will again remind you that even if we get both of those bullish confirmation clues, there are still some key technical ceilings nearby. They are the 100- day moving average line (gray) at 2000 and the 200-day moving average line (green) currently at 2026. There's even another line above that which tags all three of the market's key peaks hit late last year (dashed), presently at 2050. That whole zone is chock full of stumbling blocks for any rally effort.
The daily chart of the NASDAQ Composite (COMP) doesn't look too different, but somehow it does look a little more bullish... that is, if it can get over a hump at 4641. The V-shaped reversal effort that extends back to early February, however, looks like it's getting traction. There's also a head-and-shoulder-ish quality to it.
NASDAQ Composite & VXN Daily Chart
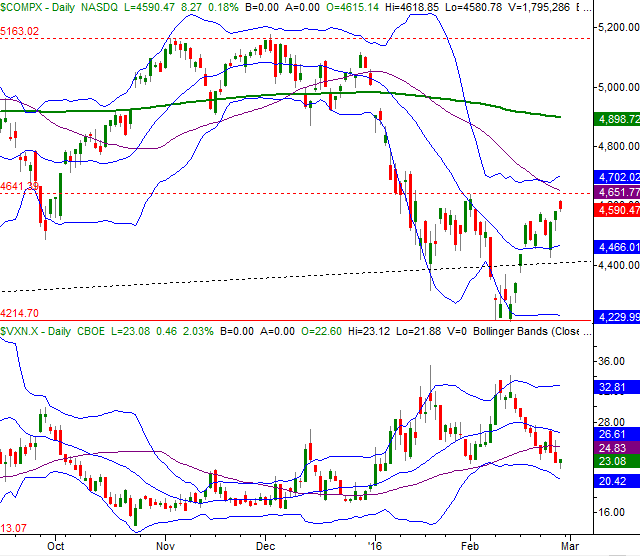
Chart created with TradeStation
Zooming out to the weekly chart of the S&P 500, we can get a little more perspective on the reversal effort. It's in this timeframe we can see how big of a deal the floor at 1812 was in establishing this reversal effort three weeks ago (beginning with a doji/hammer bar). The bullish follow-through has been quite nice since then, and if you look closely, we made a new multi-week high last week as well as made a new high close on a weekly basis.
S&P 500 & VIX Weekly Chart
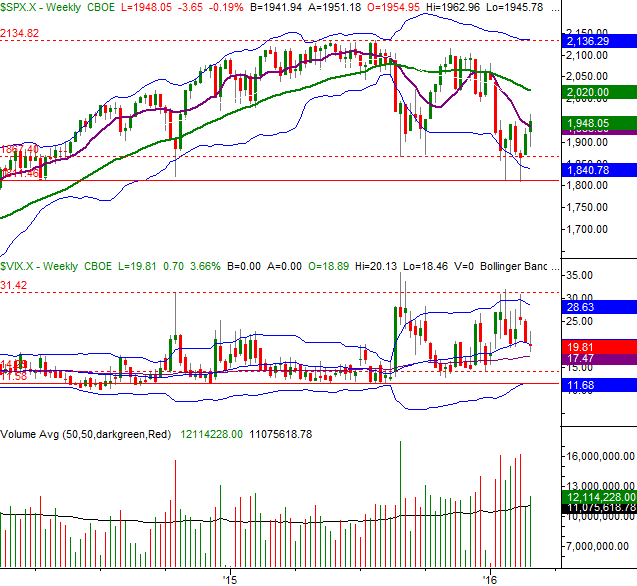
Chart created with TradeStation
It's also with the weekly chart we can see the CBOE Volatility Index (VIX) (VXX) has a little room - and maybe even a lot of room - to keep moving lower. This gives the bulls a little extra room to keep edging higher.
Bottom line: Just as the BigTrends TrendScore indicated at the close of last week, things are bullish, but not firmly so. The TrendScore for stocks was at 67.9 (on a scale of 0 to 100), just a bit above the 60 threshold that indicates bullishness. That's a good start, but not necessarily a bet anyone would want to take on blindly just yet. Let's see how this week progresses.
Casinos Clearing a Hurdle?
While most industries and sectors have been struggling for a while, none have been strongly for as long were as much as casino stocks have since early 2014. That, however, may be about to change.
It's been a little uncanny, but the demise of gambling stocks since march of 2014 has been almost perfectly straight-line. A couple of parallel falling resistance lines have served as guideposts for the pullback. If you take a closer look at our chart of the Dow Jones Casinos Index (DJUSCA) though, you can see both of these technical ceilings were hurdles last week thanks to a sizeable three week rally that actually got started on the heels of a reversal bar formed in early January.
Dow Jones Casinos Index - Weekly Chart
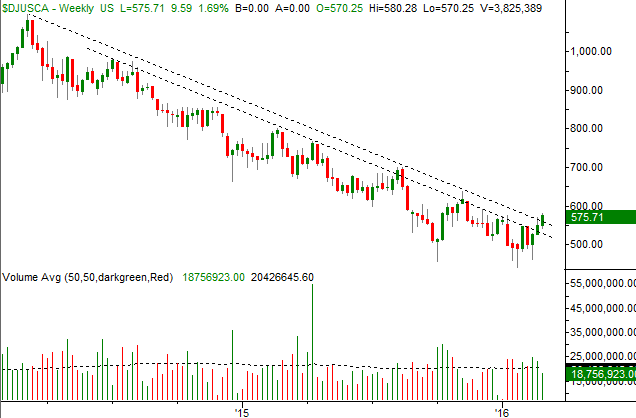
Chart created with TradeStation
An ETF that covers the gaming sector is Market Vectors Gaming ETF (BJK).
It's still a little early to (no pun intended) make a bet on the breakout as it stands. But, it wouldn't be surprising to see the group start a major recovery here and now. Aside from the fact that the headwinds in Macau are finally abating, interest in casino stocks is practically nil. That's usually about the time they find the road to recovery.
At the very least it's a group worth putting on your radar now, even if only because nobody else is looking. Another higher weekly close - particularly one that take shape after a bit of a pullback - could seal the deal.
Trade Well,
Price Headley
Disclosure: None.


