
Weekly And Seasonal US Corn And Soybean Shipment
To keep an eye on this year’s corn and soybean export shipments, I have created both a weekly and seasonal charts to check on 2016/17’s progress vs. our weekly and 5 year seasonal rates to see if we hit the USDA’s current yearly objectives.
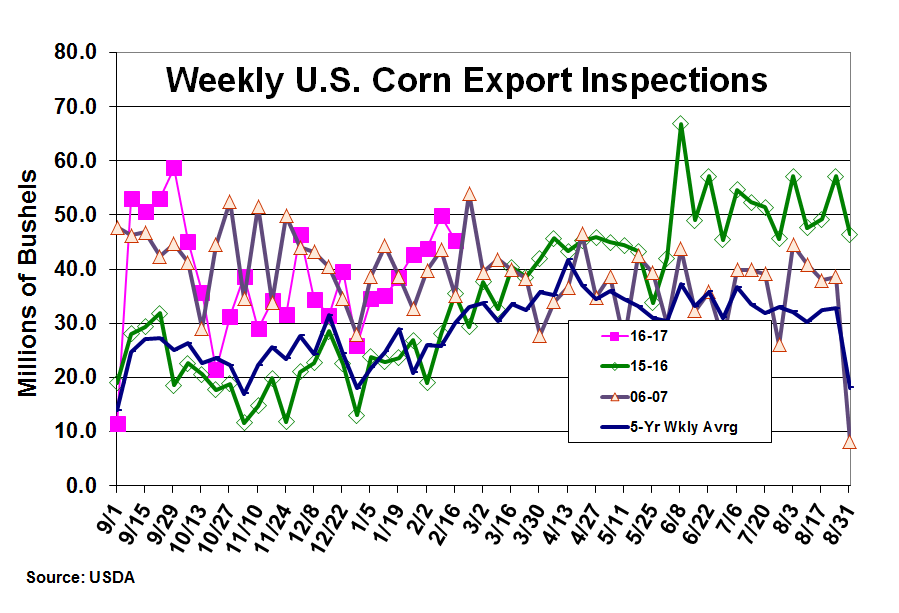
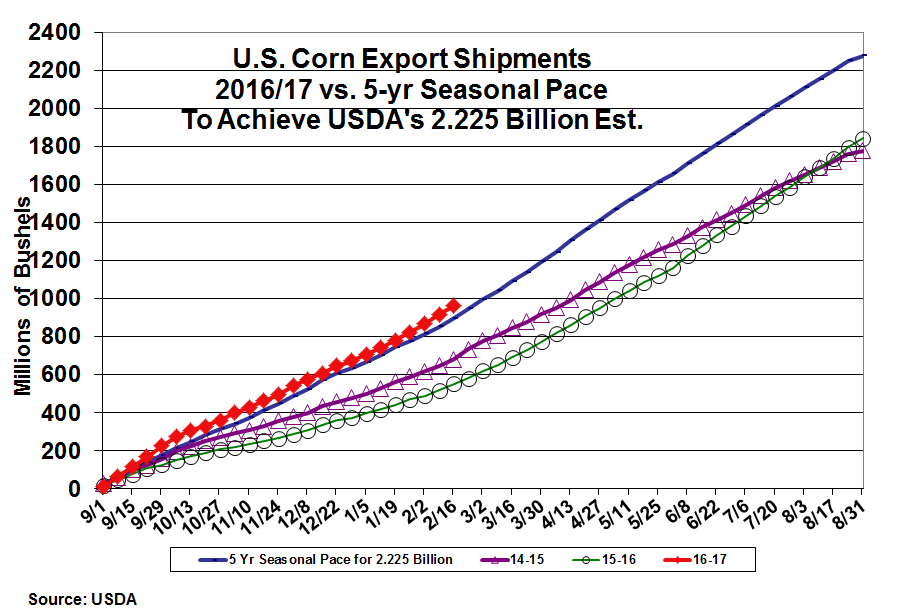
In corn, this week’s export shipments slipped about 4 million to 45.6 million bu. This brings this year’s total shipments to 961 million bu., which is sharply higher than last year’s 552 million on a similar date. However, this year’s sharply higher overall exports (2.225 billion vs. 1.898 billion) and last summer’s abnormally high weekly exports inspections has advanced our seasonal pace to 896 million level for this week in mid-February. We are 65 million bu. ahead in shipments vs. this seasonal level, but with 1.26 billion left to ship we are going to needed average 45 million the remaining 28 weeks of the crop year. The current backlog in PNW shipments needs to be cleared quickly to be able to achieve this year’s 2.225 billion bu. goal.
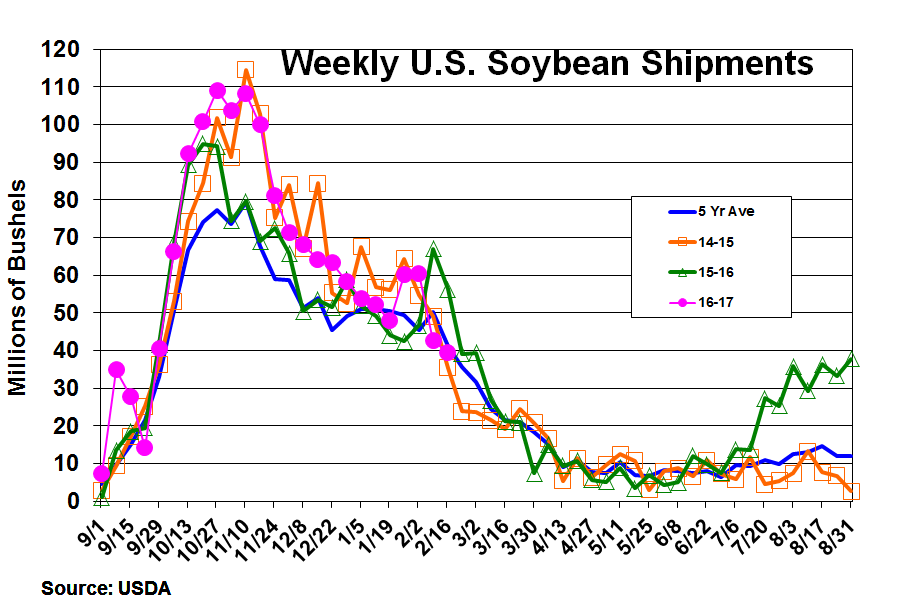
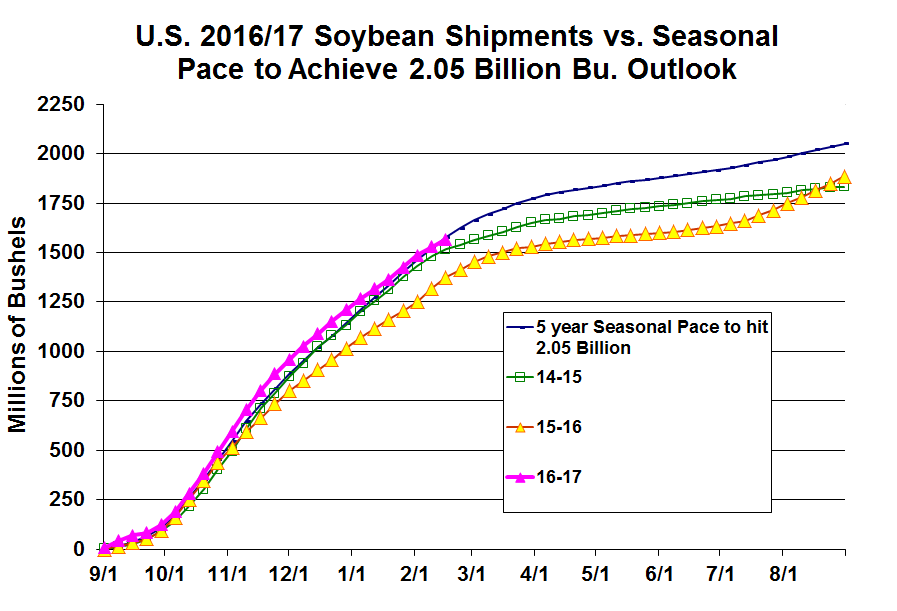
In soybeans, this week’s inspections declined a modest 3 million bu. to 39.6 million. Overall, 2016/17’s shipments have reached 1.568 million bu. which is 193 million bu. higher than last year on the same date. 2016/17’s shipments have been running ahead of their need 5 year seasonal pace to hit the USDA’s record 2.05 billion bu. until recently when we have slipped back to just our seasonal level this week. Given the unusually high export shipment last summer because of reduced American supplies, we need to outpace our remaining 17.2 million average weekly pace over the next 4-6 weeks to have 2016/17 shipment in position to achieve the USDA’s 2.05 billion bu. forecast.
We are entering an important period export shipping period where all our available grain shipping ports in both the Gulf and PNW need to be running at near capacity to move this year’s export sales it appears.
Disclaimer – The information contained in this report reflects the opinion of the author and should not be interpreted in any way to represent the thoughts of The PRICE Futures Group, any of ...
more


Nice charts. Farm products in general are doing better, however, the agricultural area are the most likely candidates to be hurt by trade wars because the US subsidizes them and they at bought from most of the countries we are threatening trade wars with. So caution is the best stance to take even though demand is increasing for now.