
Water And Gas Utilities 3-Yr Outperformance May Be Challenged By Multi-Utilities
Water and Gas Utilities have outperformed but Multi-Utilities gets the current nod technically
While the Utility sector is on the low end of total returns over the previous 3-yrs and TTM, they generated respectable returns for YTD and first 6-months 2014.
Utilities led the way for sector total returns during the first 6 months with +16%. Oil and Gas Energy came in second at 12%. The Year to Date total returns, as of Aug 8, 2014, places the utility sector 4th out of the 10 industrial sectors. However, the utility sector is rated ninth for Trailing 12 Month TTM and eighth for 3-Year total returns.
Total returns are an important performance ratio to evaluate. Many price only graphs and return calculations do not include the impact of dividends, thus potentially under-rating higher paying stocks or sectors. Total returns comparisons are especially valuable for many utility investors.
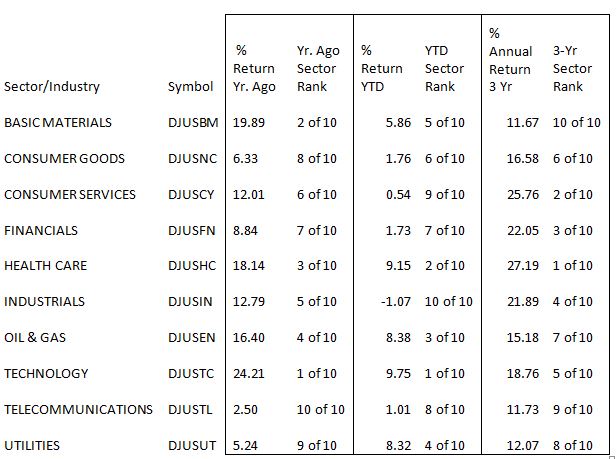
Barron’s publishes weekly a list of Dow Jones Indexes for various industrial sectors and industries on a total return basis. Below is a table of selected sector total performance data for TTM, for YTD, and for 3-Yr average annual return, as of Aug 8, 2014.
Sources: Barrons.com, MyInvestmentNavigtor.com
As shown, the utility sector has been on the bottom for comparable performance for TTM and 3-yr. However, for both the 1st 6 months 2014 and YTD 2014, the utility sector has performed substantially better.
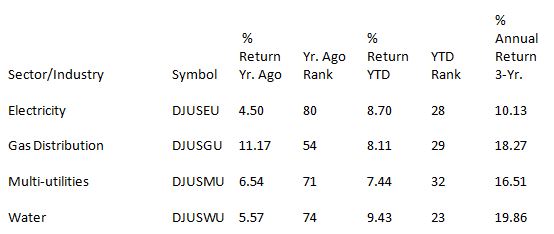
Within the sector, the DJ industry indexes also offer total return data as well. Below are the four industries of the DJ Utility sector and their specific performance data. The 10 sectors include 97 separate industries and the ranking below is where these fall within the 97 industries.
Sources: Barrons.com, MyInvestmentNavigtor.com
Of these four, the best shareholder rewards were in the Gas Distribution and Water industries. The specific companies included in these indexes are listed at the end of this article. Total components incorporated in each of the sub-industries listed in the Barron’s list can be found on stockcharts.com.
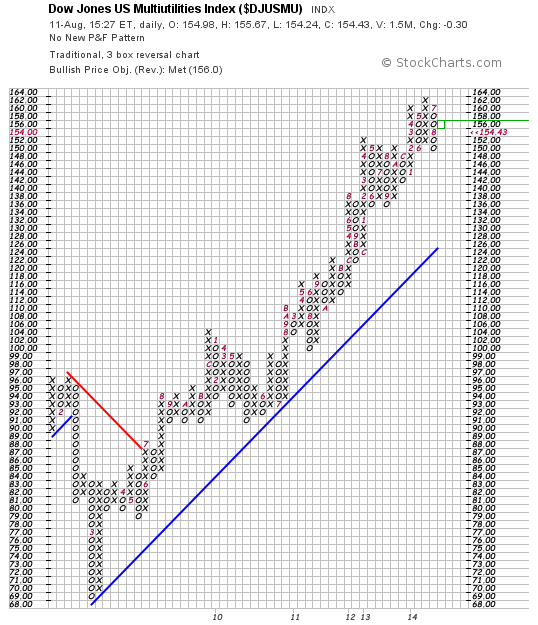
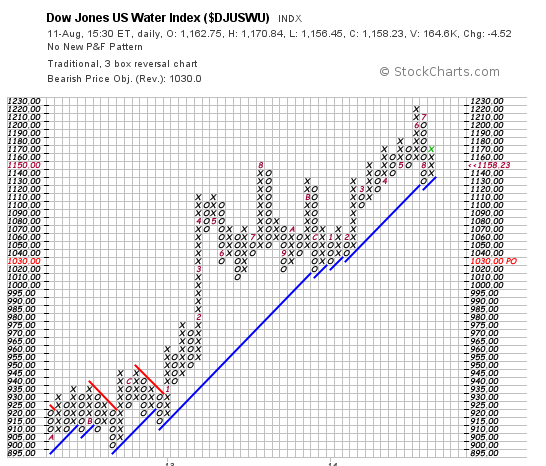
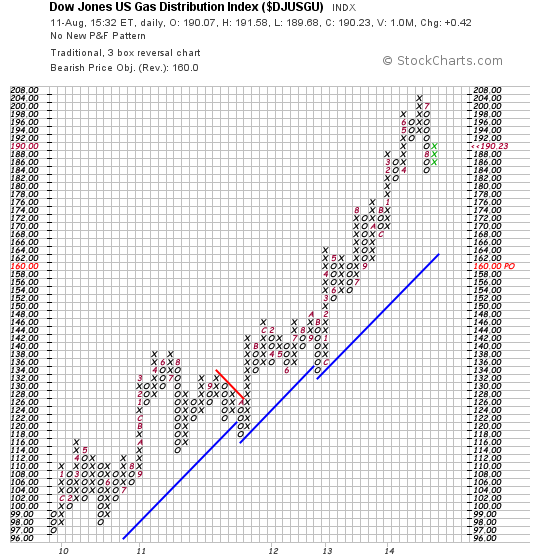
However, while the Water and Gas Distribution industries have turned in the best total performance over the previous three years, technically only the Multi-Utility index (DJUSUO) is currently rated as a buy according to the Point and Figure charts on stockcharts.com. However, the initial price target has been met and the Index needs to strengthen slightly to reinforce the bullish trend. Below are the technical charts for the four component indexes above: Multi-utilities, Electricity (DJUSEU), Gas Distribution (DJUSGU), and Water (DJUSWU):
Multi-Utilities
Water
Gas Distribution
Electricity

Reviewing the linked P&F chart for each Multi-utility component on stockcharts.com would produce the following list of stocks targeted as “Bullish” along with their comments, including targeted upside and the next major support price, as of Aug 10:
Ameren (AEE): Bullish, High Pole Warning on Aug 6 is a cautious reading, target met, breakout above $40
Avista (AVA): Bullish since March 2014, 22% target upside, reversal below $30
CNP: Bullish since March 2014, target met, reversal below $22
DUK: Bullish, no new P&F pattern, 39% target upside, breakout above $73
EONGY: Bullish High Pole Warning on Aug 1 is a cautious reading, 44% target upside, breakout above $19.50
GDFZY: Bullish, no new P&F pattern, 44% target upside, breakout above $29
NGG: Bullish, no new P&F pattern, target met, breakout above $74
SRE: Bullish, no new P&F pattern, target met, reversal below $97
VVC: Bullish, High Pole Warning on Aug 4 is a cautious reading, target met, breakout above $40
From stockchart.com concerning their price targets:
Important: Price objectives should not be used as the sole reason for buying or selling a security. Even though these objectives stem from a bullish or bearish P&F signal, they are just general guidelines on what to expect based on the strength of the move. Some securities reverse before reaching their price objective and some reach their price objective. A lot can change after a given signal. Chartists should continually monitor the technical situation for signs that validate or invalidate the Price Objective. to finances.
It seems the industries that have led the utility performance higher could be considered technically overvalued. While there are individual stocks which are technially better than the index as a whole, it would seem as a industry, investors may want to scan the Multi-Utility industries for new ideas.
Author’s Note: Please review important disclaimer in author’s profile.
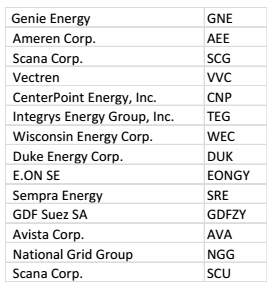
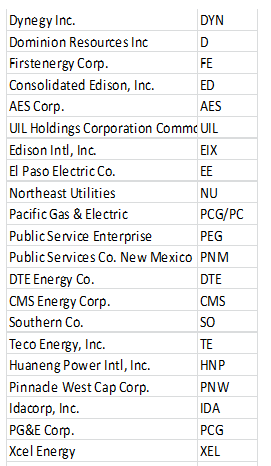
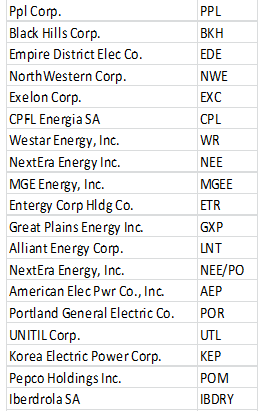
Components of Multi-Utility Index (DJUSMU)
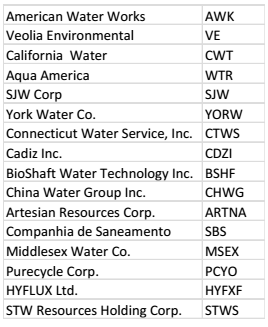
Components of Water Index (DJUSWU)
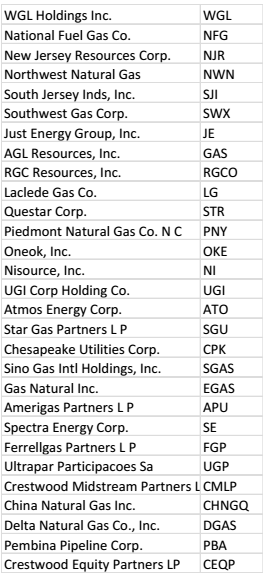
Components of Gas Distribution (DJUSGU)
Components of Electricity (DJUSEU)
Disclosure: The author is long SO, AEP, EXC, SE."


