
Watch This Pattern In The S&P 500 And VIX
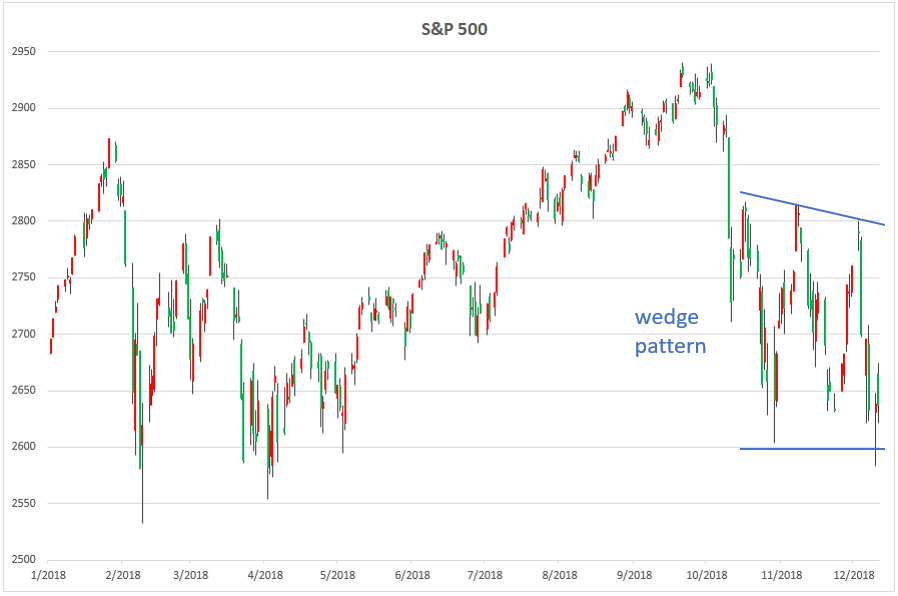
In the past month, the U.S. stock market has chopped all over the place while getting nowhere in the end. Many traders have been whipsawed by market’s erratic recent action as they hope for another clear trend to form instead of back and forth reversals. Interestingly, during this time, the S&P 500 has been forming a wedge pattern that indicates that another significant trend is likely ahead once the market breaks out from this pattern (up or down). If the market breaks down from this pattern in a convincing manner, another phase of the sell-off that started in October is likely to occur. On the other hand, a convincing bullish breakout from this pattern would likely indicate that the market will attempt to re-test its September highs.
(Click on image to enlarge)
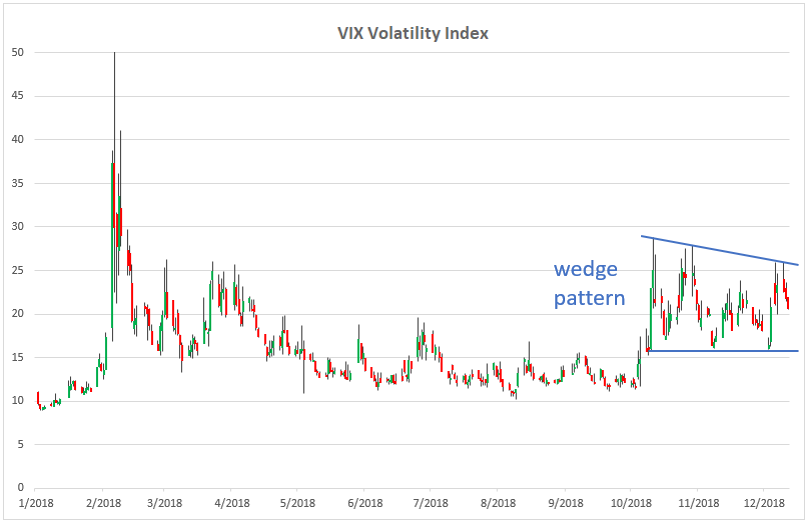
The chart below shows the VIX Volatility Index, which appears to be forming a wedge pattern that may indicate that another big move is ahead. If the VIX breaks out of this pattern in a convincing manner, it would likely lead to even higher volatility and fear (which would correspond with another leg down in the stock market). On the other hand, if the VIX breaks down from this pattern, it could be the sign of a more extended market bounce or Santa Claus rally ahead.
(Click on image to enlarge)
For now, I am watching which way these patterns break out and if the breakouts confirm each other.
For the author's full disclosure policy, click here.


