
Wall Street Giant Morgan Stanley Posts Strong Results
Morgan Stanley (MS) is a preeminent global financial services firm that maintains leading market positions in each of its three primary businesses: securities; asset management; and credit services. The company combines global strength in investment banking and institutional sales and trading with strength in providing full-service and on-line brokerage services, investment and global asset management services and, primarily through its Discover Card brand, quality consumer credit products.
Morgan Stanley posted a nice beat today, with a profit of $0.85/share. That was $0.07/share higher than consensus estimates. Net revenues were $9.9 billion for the first quarter compared with $9.0 billion a year ago. For the current quarter, income from continuing operations applicable to Morgan Stanley was $2.4 billion, or $1.18 per diluted share, compared with income of $1.5 billion, or $0.74 per diluted share, 8 for the same period a year ago. Results for the current quarter included a net discrete tax benefit of $564 million or $0.29 per diluted share primarily associated with the repatriation of non-U.S. earnings at a lower cost than originally estimated.
Revenues were the highest in almost eight years, and were second highest in company history. Trading revenues were strong, up 26% year-over-year. CEO James Gorman said that performance was strong in most areas at the firm. The company seems to be doing well despite various fines and settlements related to pre-financial crisis mortgage shenanigans.
ValuEngine continues its BUY recommendation on MORGAN STANLEY. Based on the information we have gathered and our resulting research, we feel that MORGAN STANLEY has the probability to OUTPERFORM average market performance for the next year. The company exhibits ATTRACTIVE Company Size and P/E Ratio.
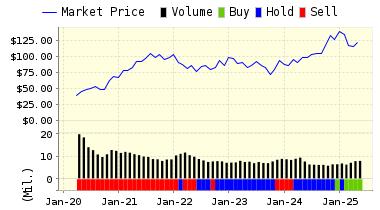
Below is today's data on MS:
|
ValuEngine Forecast |
||
|
Target |
Expected |
|
|---|---|---|
|
1-Month |
37.07 | 0.87% |
|
3-Month |
37.37 | 1.68% |
|
6-Month |
38.27 | 4.14% |
|
1-Year |
40.60 | 10.49% |
|
2-Year |
39.84 | 8.42% |
|
3-Year |
31.24 | -14.99% |
|
Valuation & Rankings |
|||
|
Valuation |
1.52% overvalued |
Valuation Rank |
|
|
1-M Forecast Return |
0.87% |
1-M Forecast Return Rank |
|
|
12-M Return |
19.47% |
Momentum Rank |
|
|
Sharpe Ratio |
0.11 |
Sharpe Ratio Rank |
|
|
5-Y Avg Annual Return |
3.95% |
5-Y Avg Annual Rtn Rank |
|
|
Volatility |
36.17% |
Volatility Rank |
|
|
Expected EPS Growth |
18.82% |
EPS Growth Rank |
|
|
Market Cap (billions) |
71.93 |
Size Rank |
|
|
Trailing P/E Ratio |
14.41 |
Trailing P/E Rank |
|
|
Forward P/E Ratio |
12.13 |
Forward P/E Ratio Rank |
|
|
PEG Ratio |
0.77 |
PEG Ratio Rank |
|
|
Price/Sales |
2.10 |
Price/Sales Rank |
|
|
Market/Book |
1.15 |
Market/Book Rank |
|
|
Beta |
2.17 |
Beta Rank |
|
|
Alpha |
-0.08 |
Alpha Rank |
|
Disclosure: None
As a bonus, we are offering a FREE DOWNLOAD of one of our Stock Reports. Read our Complete Detailed Valuation Report on United States Steel more


