
VIX "Normal" Price Range Using TPO Profile Study
TPO stands for Time Price Opportunity. By using a TPO profile chart, you are able to analyze the amount of trading activity, based on time, for each price level that the market traded at for any given time period. The Point of Control (POC) is the price where it spent the most time during that period and in that timeframe.
If you look at the following monthly chart of the VIX with the TPO profile study added to it along the right-hand side, you'll see that its POC (on a monthly basis) since 1986 is 20.53.
Whereas, the TPO POC on a daily timeframe from 1986 is 14.66, as shown on the daily chart below.
This tells me that the average "normal" range of the VIX during the past 33 years is between 14.66 and 20.53, regardless of its trading activity on either a monthly or daily timeframe.
I'd also go a bit further and say that any time it traded outside that range for any length of time, it was "unusual" and, therefore, unsustainable...something to consider when you're taking longer position trades in equities.
As of Thursday's close, the VIX was trading in "unusual" territory at 13.23...below the "normal" range, where it has spent most of its time since the November 2016 general election.
The last time it spent the majority of its time below the "normal" range was from 2005 to 2007 leading up to the 2008/09 financial crisis.
Is today's trading environment any different than it has been during the past 33 years where we'll see the VIX held below its "normal" range for a very long time going forward? We'll see...
(Click on image to enlarge)
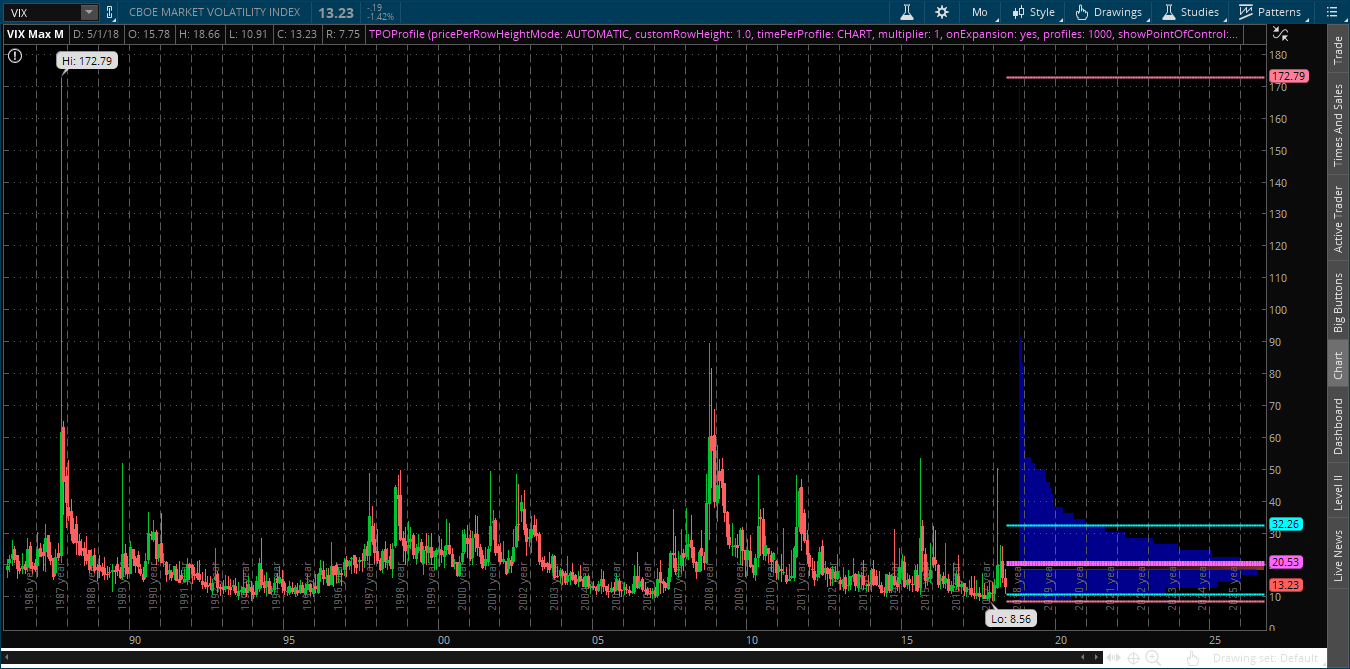
VIX Monthly
(Click on image to enlarge)

VIX Daily


